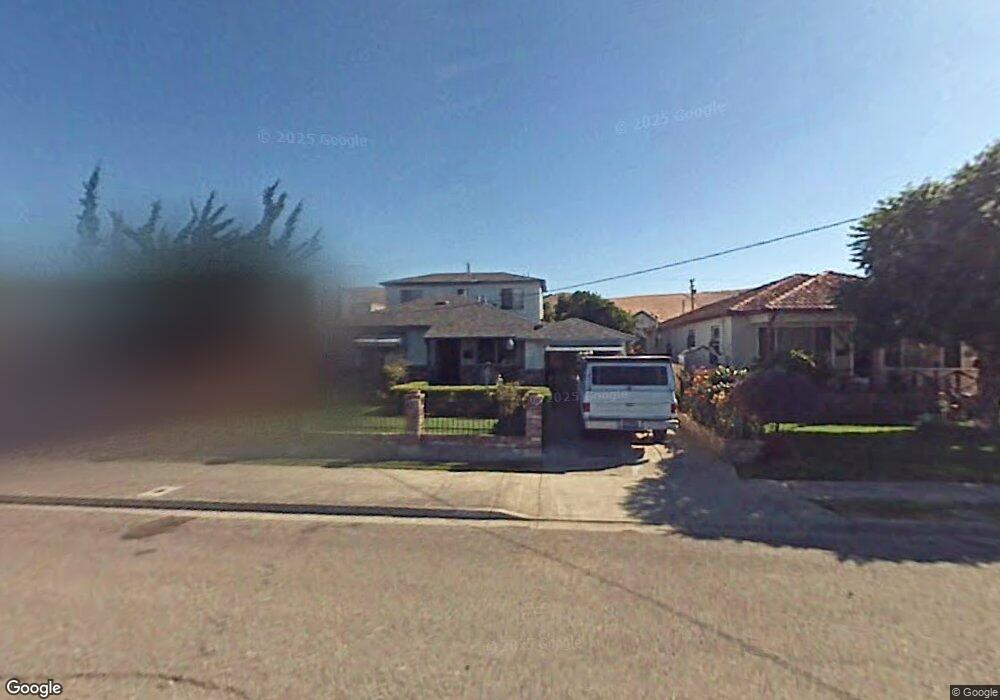
33548 3rd St Union City, CA 94587
Downtown Union City NeighborhoodEstimated Value: $981,000 - $1,073,000
5
Beds
2
Baths
1,732
Sq Ft
$594/Sq Ft
Est. Value
About This Home
This home is located at 33548 3rd St, Union City, CA 94587 and is currently estimated at $1,027,997, approximately $593 per square foot. 33548 3rd St is a home located in Alameda County with nearby schools including Guy Jr. Emanuele Elementary School, Cesar Chavez Middle School, and James Logan High School.
Ownership History
Date
Name
Owned For
Owner Type
Purchase Details
Closed on
May 10, 2018
Sold by
Sanchez Santiago and The Santiago Sanchez Jr And Vi
Bought by
Sanchez Santiago and Sanchez Virginia
Current Estimated Value
Purchase Details
Closed on
Nov 22, 2017
Sold by
Sanchez Santiago
Bought by
Sanchez Santiago and Sanchez Virginia
Home Financials for this Owner
Home Financials are based on the most recent Mortgage that was taken out on this home.
Original Mortgage
$170,000
Outstanding Balance
$142,565
Interest Rate
3.88%
Mortgage Type
New Conventional
Estimated Equity
$885,432
Purchase Details
Closed on
Jan 18, 2017
Sold by
Sanchez Santiago
Bought by
Sanchez Santiago and The Santiago Jr & Virginia San
Purchase Details
Closed on
Nov 23, 2016
Sold by
Ceja Carlos
Bought by
Sanchez Santiago
Purchase Details
Closed on
Feb 26, 2014
Sold by
Ceja Federico and Ceja Federico C
Bought by
Ceja Federico C and Federico C Ceja Revocable Trus
Create a Home Valuation Report for This Property
The Home Valuation Report is an in-depth analysis detailing your home's value as well as a comparison with similar homes in the area
Home Values in the Area
Average Home Value in this Area
Purchase History
| Date | Buyer | Sale Price | Title Company |
|---|---|---|---|
| Sanchez Santiago | -- | First American Title Company | |
| Sanchez Santiago | -- | First American Title Company | |
| Sanchez Santiago | -- | First American Title Company | |
| Sanchez Santiago | -- | None Available | |
| Sanchez Santiago | -- | None Available | |
| Ceja Carlos | -- | None Available | |
| Ceja Federico C | -- | None Available |
Source: Public Records
Mortgage History
| Date | Status | Borrower | Loan Amount |
|---|---|---|---|
| Open | Sanchez Santiago | $170,000 |
Source: Public Records
Tax History
| Year | Tax Paid | Tax Assessment Tax Assessment Total Assessment is a certain percentage of the fair market value that is determined by local assessors to be the total taxable value of land and additions on the property. | Land | Improvement |
|---|---|---|---|---|
| 2025 | $10,124 | $702,138 | $210,641 | $491,497 |
| 2024 | $10,124 | $688,374 | $206,512 | $481,862 |
| 2023 | $9,804 | $674,877 | $202,463 | $472,414 |
| 2022 | $9,635 | $661,645 | $198,493 | $463,152 |
| 2021 | $9,422 | $648,674 | $194,602 | $454,072 |
| 2020 | $9,216 | $642,025 | $192,607 | $449,418 |
| 2019 | $9,306 | $629,441 | $188,832 | $440,609 |
| 2018 | $9,093 | $617,100 | $185,130 | $431,970 |
| 2017 | $2,036 | $64,904 | $16,507 | $48,397 |
| 2016 | $1,965 | $63,632 | $16,184 | $47,448 |
| 2015 | $1,916 | $62,675 | $15,940 | $46,735 |
| 2014 | $1,720 | $61,448 | $15,628 | $45,820 |
Source: Public Records
Map
Nearby Homes
- 33603 3rd St
- 33638 9th St
- 33545 9th St
- 33834 9th St
- 33840 10th St
- 33848 10th St
- 33853 10th St
- 33528 13th St
- 33721 12th St
- 1085 La Brea Terrace
- 33359 University Dr
- 1013 Montoya Terrace Unit 5
- 137 Tamarack Dr
- 1729 Sherman Dr
- 1716 Dalton Way
- 2038 Hartnell St
- 35185 11th St Unit 274
- 113 Lafayette Ave
- 261 Famoso Plaza
- 235 Famoso Plaza
Your Personal Tour Guide
Ask me questions while you tour the home.