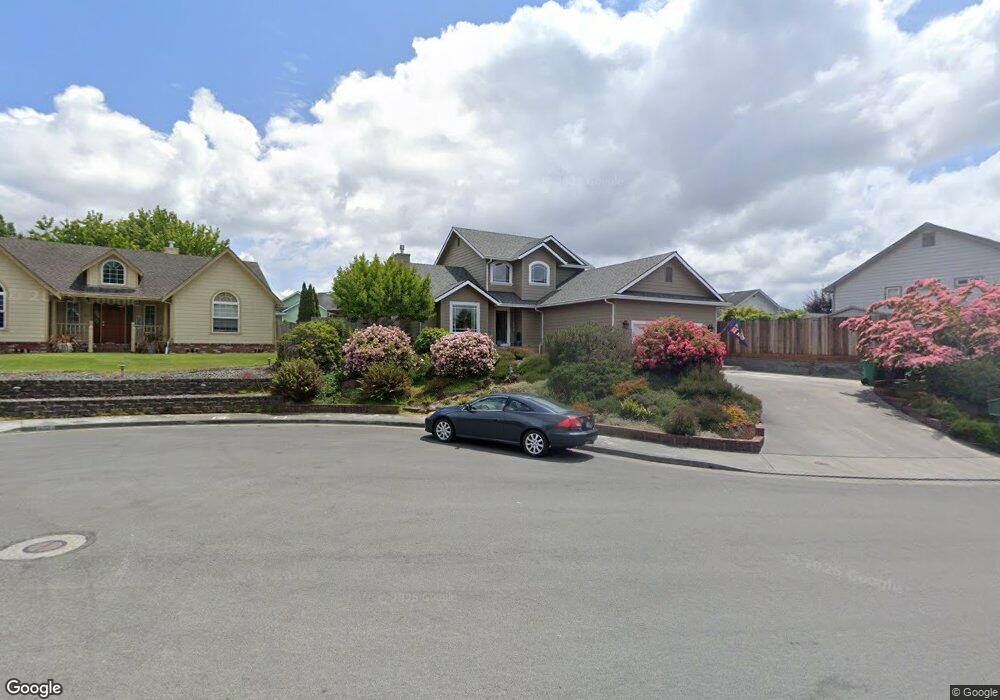
3357 Creekside Ct Fortuna, CA 95540
Estimated Value: $460,000 - $553,000
3
Beds
2
Baths
1,800
Sq Ft
$279/Sq Ft
Est. Value
About This Home
This home is located at 3357 Creekside Ct, Fortuna, CA 95540 and is currently estimated at $502,458, approximately $279 per square foot. 3357 Creekside Ct is a home located in Humboldt County with nearby schools including Fortuna Union High School, East High School, and Redwood Preparatory Charter School.
Ownership History
Date
Name
Owned For
Owner Type
Purchase Details
Closed on
Jun 17, 2003
Sold by
Johnson Jerry L
Bought by
Brouillard Daniel J and Brouillard Cindy A
Current Estimated Value
Home Financials for this Owner
Home Financials are based on the most recent Mortgage that was taken out on this home.
Original Mortgage
$200,000
Interest Rate
5.17%
Mortgage Type
Purchase Money Mortgage
Purchase Details
Closed on
Jan 29, 2002
Sold by
Johnson Raymond and Johnson Connie
Bought by
Johnson Jerry L
Purchase Details
Closed on
Jun 3, 1999
Sold by
Goble John C and Goble Robin R
Bought by
Johnson Raymnd and Johnson Connie
Home Financials for this Owner
Home Financials are based on the most recent Mortgage that was taken out on this home.
Original Mortgage
$21,000
Interest Rate
7.05%
Mortgage Type
Seller Take Back
Create a Home Valuation Report for This Property
The Home Valuation Report is an in-depth analysis detailing your home's value as well as a comparison with similar homes in the area
Home Values in the Area
Average Home Value in this Area
Purchase History
| Date | Buyer | Sale Price | Title Company |
|---|---|---|---|
| Brouillard Daniel J | $300,000 | Humboldt Land Title Company | |
| Johnson Jerry L | $42,500 | First American Title Ins Co | |
| Johnson Raymnd | $41,000 | Financial Title Company |
Source: Public Records
Mortgage History
| Date | Status | Borrower | Loan Amount |
|---|---|---|---|
| Previous Owner | Brouillard Daniel J | $200,000 | |
| Previous Owner | Johnson Raymnd | $21,000 |
Source: Public Records
Tax History Compared to Growth
Tax History
| Year | Tax Paid | Tax Assessment Tax Assessment Total Assessment is a certain percentage of the fair market value that is determined by local assessors to be the total taxable value of land and additions on the property. | Land | Improvement |
|---|---|---|---|---|
| 2025 | $4,608 | $426,518 | $71,078 | $355,440 |
| 2024 | $4,608 | $418,156 | $69,685 | $348,471 |
| 2023 | $4,468 | $409,958 | $68,319 | $341,639 |
| 2022 | $4,408 | $401,921 | $66,980 | $334,941 |
| 2021 | $4,391 | $394,041 | $65,667 | $328,374 |
| 2020 | $4,512 | $390,001 | $64,994 | $325,007 |
| 2019 | $4,432 | $382,355 | $63,720 | $318,635 |
| 2018 | $4,379 | $374,859 | $62,471 | $312,388 |
| 2017 | $4,177 | $367,510 | $61,247 | $306,263 |
| 2016 | $4,079 | $360,305 | $60,047 | $300,258 |
| 2015 | $3,966 | $354,894 | $59,146 | $295,748 |
| 2014 | $3,868 | $347,943 | $57,988 | $289,955 |
Source: Public Records
Map
Nearby Homes
- 1545 Xavier Ct
- 3251 Matthew Ln
- 1274 Ross Hill Rd
- 3310 School St
- 4391 Woodcock Ct
- 4372 Forest Hills Dr
- 462 Francesco Place
- 2550 W School St
- 201 Ridge View Ct
- 148 Ridge View Ct
- 1545 Kings Row
- 109 Pampas Ln
- 2208 Royal Dr
- 2755 Highland Dr
- 184 Empire Dr
- 197 Empire Dr
- 1521 Imperial Way
- 185 Empire Dr
- 136 Castle Ct
- 160 Monarch Dr
- 1697 Greenfield Place
- 3329 Creekside Ct
- 3381 Creekside Ct
- 1675 Greenfield Place
- 3360 Covey Ct
- 3334 Covey Ct
- 3378 Creekside Ct
- 3366 Creekside Ct
- 3372 Covey Ct
- 3320 Creekside Ct
- 3342 Creekside Ct
- 1718 Greenfield Place
- 1684 Justice Ct
- 1710 Justice Ct
- 3950 Greenfield Place
- 3372 Creekside Ct
- 1700 Greenfield Place
- 1672 Greenfield Place
- 1734 Justice Ct
- 1668 Justice Ct