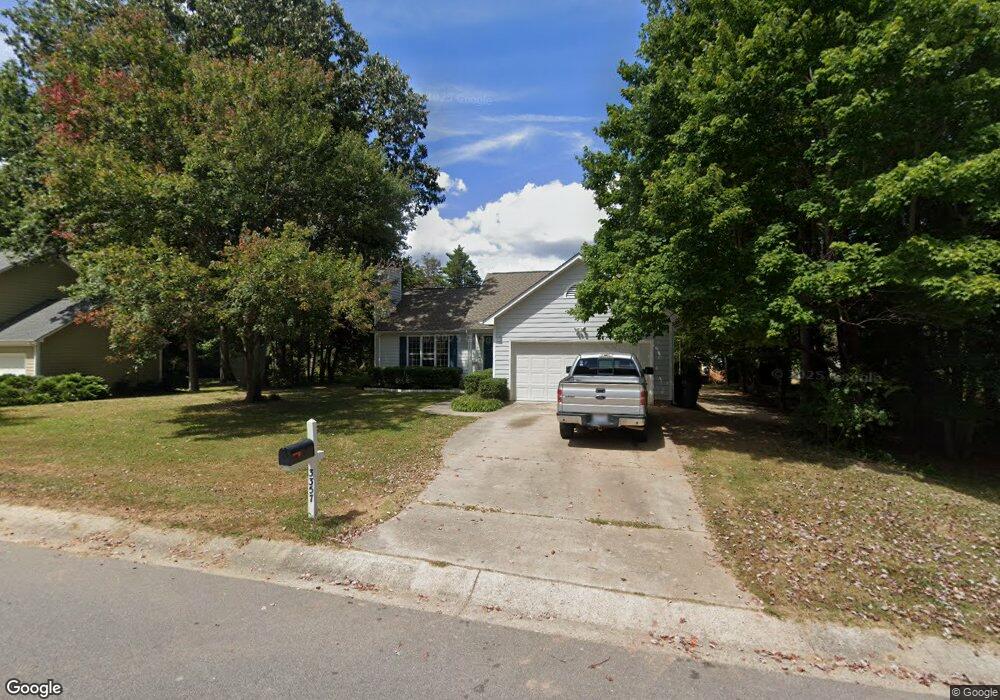
3357 Daingerfield Dr Raleigh, NC 27616
Forestville NeighborhoodEstimated Value: $327,000 - $358,000
3
Beds
2
Baths
1,360
Sq Ft
$250/Sq Ft
Est. Value
About This Home
This home is located at 3357 Daingerfield Dr, Raleigh, NC 27616 and is currently estimated at $340,639, approximately $250 per square foot. 3357 Daingerfield Dr is a home located in Wake County with nearby schools including Harris Creek Elementary School, Rolesville Middle School, and Rolesville High School.
Ownership History
Date
Name
Owned For
Owner Type
Purchase Details
Closed on
May 31, 2019
Sold by
Equity Trust Company
Bought by
Yamasa Co Ltd
Current Estimated Value
Purchase Details
Closed on
May 30, 2019
Sold by
Equity Trust Company Custodian Fbo Cang
Bought by
Yamasa Co Ltd
Purchase Details
Closed on
Feb 14, 2019
Sold by
Simmons Ellis P
Bought by
Equity Trust Company
Purchase Details
Closed on
Jul 25, 2006
Sold by
Simmons Pamela R
Bought by
Simmons Ellis
Home Financials for this Owner
Home Financials are based on the most recent Mortgage that was taken out on this home.
Original Mortgage
$36,500
Interest Rate
6.74%
Mortgage Type
Stand Alone Second
Purchase Details
Closed on
Sep 29, 1995
Bought by
Simmons Ellis
Create a Home Valuation Report for This Property
The Home Valuation Report is an in-depth analysis detailing your home's value as well as a comparison with similar homes in the area
Home Values in the Area
Average Home Value in this Area
Purchase History
| Date | Buyer | Sale Price | Title Company |
|---|---|---|---|
| Yamasa Co Ltd | $210,500 | None Available | |
| Yamasa Co Ltd | $210,500 | None Listed On Document | |
| Equity Trust Company | $161,148 | None Available | |
| Simmons Ellis | -- | None Available | |
| Simmons Ellis | $131,000 | -- |
Source: Public Records
Mortgage History
| Date | Status | Borrower | Loan Amount |
|---|---|---|---|
| Previous Owner | Simmons Ellis | $36,500 | |
| Previous Owner | Simmons Ellis | $116,500 |
Source: Public Records
Tax History
| Year | Tax Paid | Tax Assessment Tax Assessment Total Assessment is a certain percentage of the fair market value that is determined by local assessors to be the total taxable value of land and additions on the property. | Land | Improvement |
|---|---|---|---|---|
| 2025 | $2,860 | $325,687 | $80,000 | $245,687 |
| 2024 | $2,849 | $325,687 | $80,000 | $245,687 |
Source: Public Records
Map
Nearby Homes
- 3400 Kensett Way
- 3341 Daingerfield Dr
- 3656 Epperly Ct
- 3217 Pomegranate Dr
- 3509 Pinkham Way
- 3448 Suncrest Village Ln
- 3609 Bretton Mill Dr
- 3600 Cadler Ct
- 3200 Daingerfield Dr
- 3421 Tunas St
- 3822 Granite Mill Way
- 3814 Granite Mill Way
- 3500 Limber Ln
- 4100 Lodge Allen Ct
- 4104 Lodge Allen Ct
- 3805 Lodgepole Ln
- 3812 Lodgepole Ln
- 3709 Fan Palm Ct
- 3605 Iron Sight Ct
- 3624 Iron Sight Ct
- 3349 Dangerfield Dr
- 3401 Dangerfield Dr
- 3349 Daingerfield Dr
- 3401 Daingerfield Dr
- 3404 Kensett Way
- 3345 Daingerfield Dr
- 3349 Potthast Ct
- 3348 Potthast Ct
- 3401 Kensett Way
- 3524 Dewing Dr
- 3520 Dewing Dr
- 3408 Kensett Way
- 3348 Daingerfield Dr
- 3516 Dewing Dr
- 3528 Dewing Dr
- 3341 Dangerfield Dr
- 3405 Kensett Way
- 3344 Potthast Ct
- 3345 Potthast Ct
- 3512 Dewing Dr
Your Personal Tour Guide
Ask me questions while you tour the home.