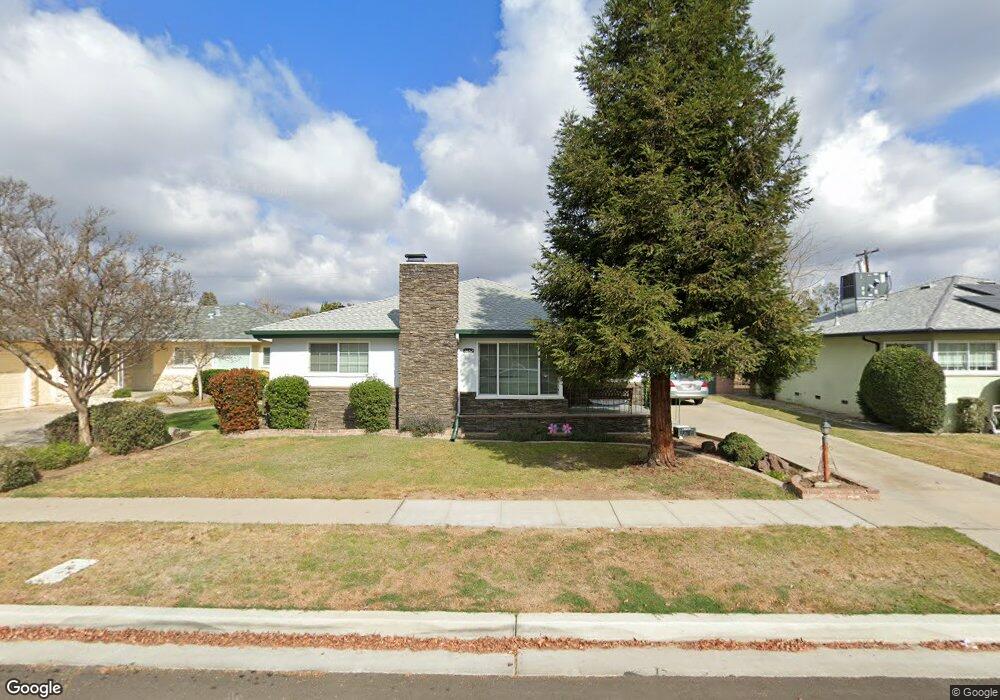
3357 E Austin Way Fresno, CA 93726
Hoover NeighborhoodEstimated Value: $315,954 - $365,000
3
Beds
2
Baths
1,640
Sq Ft
$212/Sq Ft
Est. Value
About This Home
This home is located at 3357 E Austin Way, Fresno, CA 93726 and is currently estimated at $348,239, approximately $212 per square foot. 3357 E Austin Way is a home located in Fresno County with nearby schools including Thomas Elementary School, Tioga Middle School, and Herbert Hoover High School.
Ownership History
Date
Name
Owned For
Owner Type
Purchase Details
Closed on
Jan 3, 2003
Sold by
Bolger Marc Christian and Saul Bolger Mary Q
Bought by
Bolger Marc Christian and Saul Bolger Mary Q
Current Estimated Value
Home Financials for this Owner
Home Financials are based on the most recent Mortgage that was taken out on this home.
Original Mortgage
$99,750
Interest Rate
6.06%
Purchase Details
Closed on
Aug 27, 1997
Sold by
Howell Marguerite H
Bought by
Bolger Marc Christian and Saul Mary Q
Home Financials for this Owner
Home Financials are based on the most recent Mortgage that was taken out on this home.
Original Mortgage
$94,070
Interest Rate
7.54%
Mortgage Type
FHA
Purchase Details
Closed on
May 10, 1995
Sold by
Ludy Pauline L
Bought by
Howell Marguerite H
Purchase Details
Closed on
Aug 3, 1994
Sold by
Buthe T Curtis and Buthe Ana Yolanda
Bought by
Howell Marguerite H
Create a Home Valuation Report for This Property
The Home Valuation Report is an in-depth analysis detailing your home's value as well as a comparison with similar homes in the area
Home Values in the Area
Average Home Value in this Area
Purchase History
| Date | Buyer | Sale Price | Title Company |
|---|---|---|---|
| Bolger Marc Christian | -- | Fidelity National Title Co | |
| Bolger Marc Christian | $94,500 | Landmark Title Company | |
| Howell Marguerite H | -- | Fidelity National Title Ins | |
| Howell Marguerite H | $87,500 | North American Title Company |
Source: Public Records
Mortgage History
| Date | Status | Borrower | Loan Amount |
|---|---|---|---|
| Closed | Bolger Marc Christian | $99,750 | |
| Closed | Bolger Marc Christian | $94,070 |
Source: Public Records
Tax History Compared to Growth
Tax History
| Year | Tax Paid | Tax Assessment Tax Assessment Total Assessment is a certain percentage of the fair market value that is determined by local assessors to be the total taxable value of land and additions on the property. | Land | Improvement |
|---|---|---|---|---|
| 2025 | $1,886 | $150,862 | $36,710 | $114,152 |
| 2023 | $1,777 | $145,006 | $35,286 | $109,720 |
| 2022 | $1,751 | $142,164 | $34,595 | $107,569 |
| 2021 | $1,702 | $139,377 | $33,917 | $105,460 |
| 2020 | $1,694 | $137,949 | $33,570 | $104,379 |
| 2019 | $1,627 | $135,245 | $32,912 | $102,333 |
| 2018 | $1,591 | $132,594 | $32,267 | $100,327 |
| 2017 | $1,562 | $129,995 | $31,635 | $98,360 |
| 2016 | $1,509 | $127,447 | $31,015 | $96,432 |
| 2015 | $1,485 | $125,534 | $30,550 | $94,984 |
| 2014 | $1,456 | $123,076 | $29,952 | $93,124 |
Source: Public Records
Map
Nearby Homes
- 4259 N 4th St
- 3413 E Ashlan Ave
- 2999 E Richert Ave
- 3214 E Griffith Way
- 4005 N 1st St
- 2972 E Northdale Ave
- 3725 E Hampton Way
- 3654 E Donner Ave
- 3789 E Hampton Way
- 2733 E Willis Ave
- 4653 N Fisher St
- 2817 E Indianapolis Ave
- 3862 N Orchard St
- 2542 E Ashcroft Ave
- 3915 E Holland Ave
- 2719 E Norwich Ave
- 4326 N Fresno St
- 3144 E Santa Ana Ave
- 3014 E Dakota Ave
- 3023 E Robinson Ave
- 3347 E Austin Way
- 3367 E Austin Way
- 3354 E Swift Ave
- 3337 E Austin Way
- 3344 E Swift Ave
- 3377 E Austin Way
- 3364 E Swift Ave
- 3334 E Swift Ave
- 3374 E Swift Ave
- 3327 E Austin Way
- 3346 E Austin Way
- 3366 E Austin Way
- 3387 E Austin Way
- 3336 E Austin Way
- 3376 E Austin Way
- 3324 E Swift Ave
- 3384 E Swift Ave
- 3317 E Austin Way
- 3326 E Austin Way