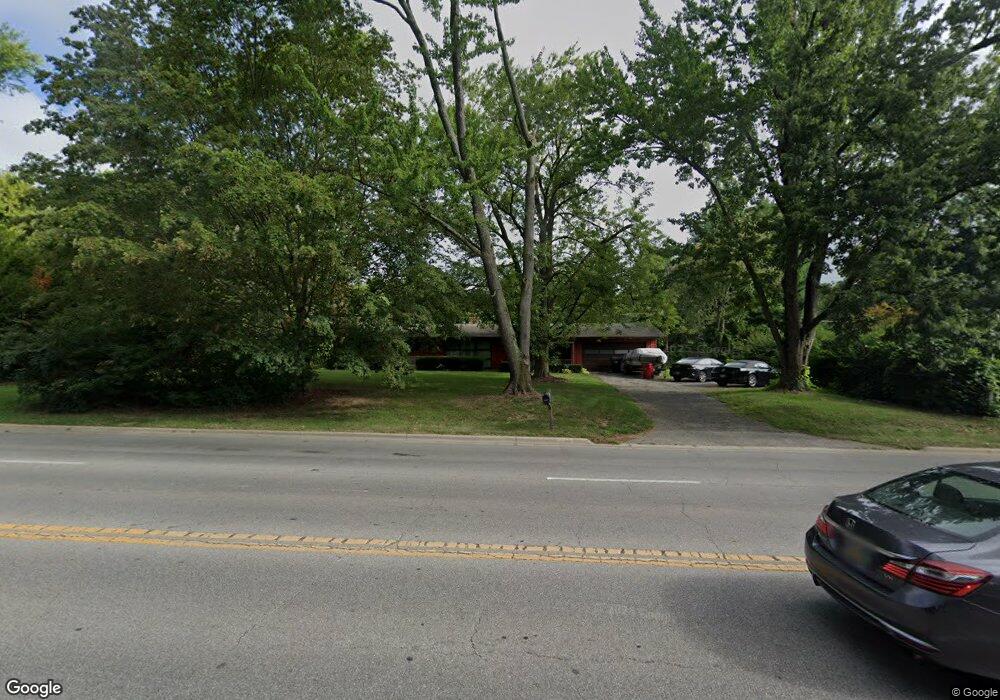
3358 Fishinger Rd Columbus, OH 43221
Riverplace NeighborhoodEstimated Value: $400,000 - $428,411
3
Beds
1
Bath
1,378
Sq Ft
$297/Sq Ft
Est. Value
About This Home
This home is located at 3358 Fishinger Rd, Columbus, OH 43221 and is currently estimated at $409,353, approximately $297 per square foot. 3358 Fishinger Rd is a home located in Franklin County with nearby schools including Ridgewood Elementary School, Hilliard Tharp Sixth Grade Elementary School, and Hilliard Weaver Middle School.
Ownership History
Date
Name
Owned For
Owner Type
Purchase Details
Closed on
Mar 30, 2006
Sold by
Perrotta Tony J and Perrotta Edna J
Bought by
Sweeney Kevin P and Sweeney Deanna J
Current Estimated Value
Home Financials for this Owner
Home Financials are based on the most recent Mortgage that was taken out on this home.
Original Mortgage
$170,926
Outstanding Balance
$95,861
Interest Rate
6.33%
Mortgage Type
FHA
Estimated Equity
$313,492
Purchase Details
Closed on
Oct 14, 2004
Sold by
Conger Thomas O and Thomas O Conger Living Trust
Bought by
Perrotta Tony J and Perrotta Edna J
Home Financials for this Owner
Home Financials are based on the most recent Mortgage that was taken out on this home.
Original Mortgage
$100,000
Interest Rate
5.5%
Mortgage Type
Purchase Money Mortgage
Purchase Details
Closed on
Oct 9, 2000
Sold by
Conger Thomas O
Bought by
Thomas O Conger Living Trust
Purchase Details
Closed on
Apr 27, 2000
Sold by
Conger Thomas O
Bought by
Conger Thomas O and Thomas O Conger Living Trust
Purchase Details
Closed on
Oct 27, 1992
Bought by
Conger Thomas O
Create a Home Valuation Report for This Property
The Home Valuation Report is an in-depth analysis detailing your home's value as well as a comparison with similar homes in the area
Home Values in the Area
Average Home Value in this Area
Purchase History
| Date | Buyer | Sale Price | Title Company |
|---|---|---|---|
| Sweeney Kevin P | $172,400 | Supreme | |
| Perrotta Tony J | $150,000 | Lawyers Tit | |
| Thomas O Conger Living Trust | -- | -- | |
| Conger Thomas O | -- | -- | |
| Conger Thomas O | -- | -- |
Source: Public Records
Mortgage History
| Date | Status | Borrower | Loan Amount |
|---|---|---|---|
| Open | Sweeney Kevin P | $170,926 | |
| Closed | Perrotta Tony J | $100,000 |
Source: Public Records
Tax History
| Year | Tax Paid | Tax Assessment Tax Assessment Total Assessment is a certain percentage of the fair market value that is determined by local assessors to be the total taxable value of land and additions on the property. | Land | Improvement |
|---|---|---|---|---|
| 2025 | $8,038 | $119,990 | $48,690 | $71,300 |
| 2024 | $8,038 | $119,990 | $48,690 | $71,300 |
| 2023 | $6,541 | $119,980 | $48,685 | $71,295 |
| 2022 | $6,319 | $91,530 | $47,600 | $43,930 |
| 2021 | $6,315 | $91,530 | $47,600 | $43,930 |
| 2020 | $6,299 | $91,530 | $47,600 | $43,930 |
| 2019 | $6,130 | $75,530 | $39,690 | $35,840 |
| 2018 | $5,360 | $75,530 | $39,690 | $35,840 |
| 2017 | $5,493 | $75,530 | $39,690 | $35,840 |
| 2016 | $4,879 | $55,900 | $19,180 | $36,720 |
| 2015 | $4,611 | $55,900 | $19,180 | $36,720 |
| 2014 | $4,619 | $55,900 | $19,180 | $36,720 |
| 2013 | $2,345 | $55,895 | $19,180 | $36,715 |
Source: Public Records
Map
Nearby Homes
- 3280 River Place Dr
- 3338 Harbor Bay Dr
- 3426 Fishinger Mill Dr Unit A8
- 3830 Riverview Dr
- 3564 Smiley Rd
- 3429 Eastwoodlands Trail Unit 3429
- 3395 Eastwoodlands Trail Unit 3395
- 3660 Hilliard Station Rd Unit 3660
- 3167 Griggsview Ct
- 4025 Dublin Rd
- 3705 Hilliard Station Rd Unit 3705
- 3055 Carriage Ln
- 3757 Mill Stream Dr Unit 12
- 3246 Summerdale Ln Unit 34
- 3120 Capstone Way
- 3558 Kinsale Head Dr Unit 560
- 3360 Scioto Run Blvd
- 3278 Brookview Way Unit 4
- 3820 Falls Circle Dr
- 3822 Falls Circle Dr Unit 23
- 3358 Fishinger Rd Unit 3358
- 3364 Fishinger Rd
- 3362 Fishinger Rd
- 3360 Fishinger Rd
- 3332 Fishinger Rd
- 3376 Fishinger Rd
- 3352 Fishinger Rd
- 3382 Fishinger Rd
- 3350 Fishinger Rd
- 3384 Fishinger Rd
- 3348 Fishinger Rd
- 3386 Fishinger Rd
- 3367 Fishinger Rd
- 3388 Fishinger Rd
- 3365 Fishinger Rd
- 3346 Fishinger Rd
- 3390 Fishinger Rd
- 3361 Fishinger Rd
- 3392 Fishinger Rd
- 3394 Fishinger Rd
Your Personal Tour Guide
Ask me questions while you tour the home.