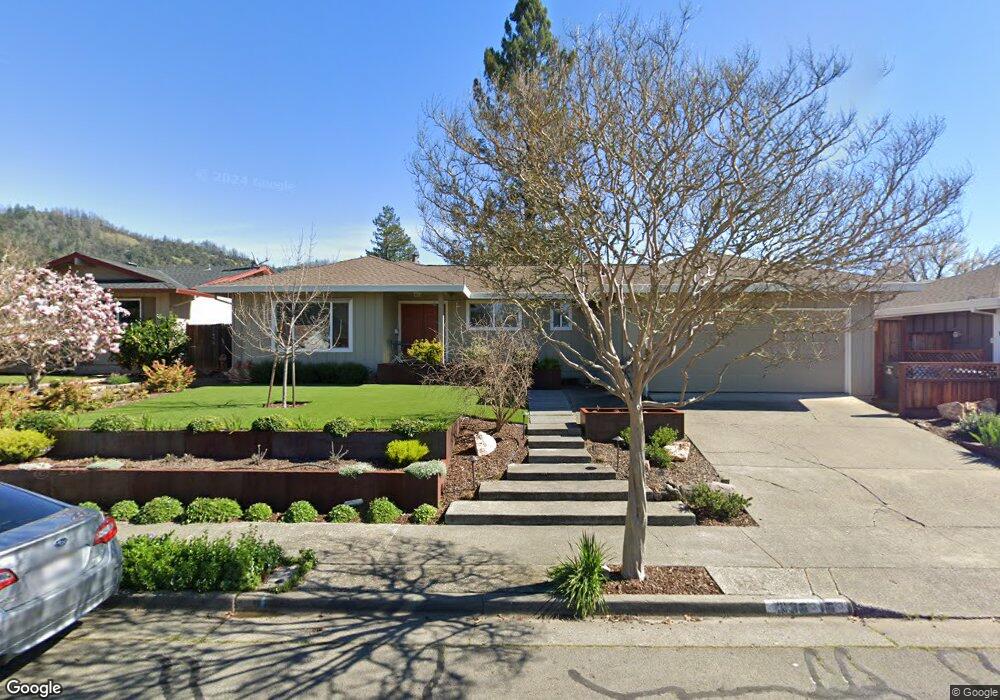
336 Beech Ave Santa Rosa, CA 95409
Skyhawk NeighborhoodEstimated Value: $729,181 - $805,000
3
Beds
2
Baths
1,613
Sq Ft
$475/Sq Ft
Est. Value
About This Home
This home is located at 336 Beech Ave, Santa Rosa, CA 95409 and is currently estimated at $766,545, approximately $475 per square foot. 336 Beech Ave is a home located in Sonoma County with nearby schools including Sequoia Elementary School, Rincon Valley Middle School, and Maria Carrillo High School.
Ownership History
Date
Name
Owned For
Owner Type
Purchase Details
Closed on
Aug 27, 2024
Sold by
Allen Thomas and Allen Suzanne
Bought by
Thomas And Suzanne Allen Revocable Trust and Allen
Current Estimated Value
Purchase Details
Closed on
Jan 20, 2010
Sold by
Allen Thomas F
Bought by
Allen Suzanne
Purchase Details
Closed on
Dec 22, 2000
Sold by
Meyers Maribeth
Bought by
Allen Thomas F and Allen Suzanne
Home Financials for this Owner
Home Financials are based on the most recent Mortgage that was taken out on this home.
Original Mortgage
$292,175
Interest Rate
9.18%
Purchase Details
Closed on
Oct 16, 1997
Sold by
Anderson Maribeth and Anderson Maribeth
Bought by
Meyers Maribeth
Home Financials for this Owner
Home Financials are based on the most recent Mortgage that was taken out on this home.
Original Mortgage
$155,000
Interest Rate
7.49%
Create a Home Valuation Report for This Property
The Home Valuation Report is an in-depth analysis detailing your home's value as well as a comparison with similar homes in the area
Home Values in the Area
Average Home Value in this Area
Purchase History
| Date | Buyer | Sale Price | Title Company |
|---|---|---|---|
| Thomas And Suzanne Allen Revocable Trust | -- | None Listed On Document | |
| Allen Thomas | -- | None Listed On Document | |
| Allen Suzanne | -- | None Available | |
| Allen Thomas F | $325,000 | New Century Title Co | |
| Meyers Maribeth | -- | North American Title Co |
Source: Public Records
Mortgage History
| Date | Status | Borrower | Loan Amount |
|---|---|---|---|
| Previous Owner | Allen Thomas F | $292,175 | |
| Previous Owner | Meyers Maribeth | $155,000 |
Source: Public Records
Tax History
| Year | Tax Paid | Tax Assessment Tax Assessment Total Assessment is a certain percentage of the fair market value that is determined by local assessors to be the total taxable value of land and additions on the property. | Land | Improvement |
|---|---|---|---|---|
| 2025 | $5,649 | $489,717 | $150,677 | $339,040 |
| 2024 | $5,649 | $480,116 | $147,723 | $332,393 |
| 2023 | $5,649 | $470,703 | $144,827 | $325,876 |
| 2022 | $5,215 | $461,475 | $141,988 | $319,487 |
| 2021 | $5,111 | $452,427 | $139,204 | $313,223 |
| 2020 | $5,092 | $447,789 | $137,777 | $310,012 |
| 2019 | $5,044 | $439,010 | $135,076 | $303,934 |
| 2018 | $5,012 | $430,403 | $132,428 | $297,975 |
| 2017 | $4,920 | $421,965 | $129,832 | $292,133 |
| 2016 | $4,866 | $413,692 | $127,287 | $286,405 |
| 2015 | $4,719 | $407,479 | $125,376 | $282,103 |
| 2014 | $4,548 | $399,498 | $122,921 | $276,577 |
Source: Public Records
Map
Nearby Homes
- 341 La Crosse Ave
- 1535 Saint Francis Rd
- 408 Calistoga Rd
- 5330 Marit Dr
- 5739 Owls Nest Dr
- 5116 Oak Park Way
- 88 Coronado Cir Unit 97
- 86 Coronado Cir
- 70 Coronado Cir
- 700 Montclair Dr
- 5783 Owl Light Terrace
- 405 Korbel Place
- 5846 Monte Verde Dr
- 5088 Firestone Ct
- 5784 Owl Hill Ave
- 5036 Algiers Ave
- 5445 Pine Hill Ct
- 311 Algiers Ct
- 5827 La Cuesta Dr
- 840 Vaughn Ct
Your Personal Tour Guide
Ask me questions while you tour the home.