Estimated Value: $299,914 - $325,000
--
Bed
--
Bath
1,428
Sq Ft
$218/Sq Ft
Est. Value
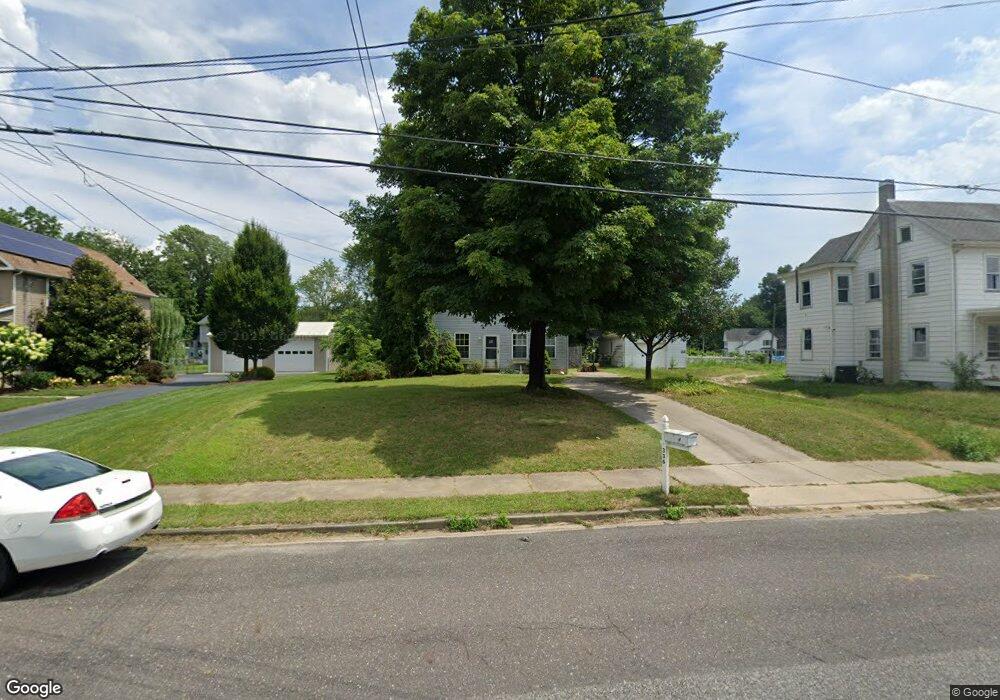
About This Home
This home is located at 336 Broad St, Elmer, NJ 08318 and is currently estimated at $311,479, approximately $218 per square foot. 336 Broad St is a home located in Salem County with nearby schools including Elmer Elementary School, Pittsgrove Township Middle School, and Arthur P. Schalick High School.
Ownership History
Date
Name
Owned For
Owner Type
Purchase Details
Closed on
Jun 29, 2007
Sold by
Kinsey Tara L
Bought by
Mason Dawn
Current Estimated Value
Home Financials for this Owner
Home Financials are based on the most recent Mortgage that was taken out on this home.
Original Mortgage
$165,000
Outstanding Balance
$103,023
Interest Rate
6.48%
Mortgage Type
New Conventional
Estimated Equity
$208,456
Purchase Details
Closed on
Sep 26, 2003
Sold by
Koepfer John and Koepfer Shannon
Bought by
Kinsey Tara L
Home Financials for this Owner
Home Financials are based on the most recent Mortgage that was taken out on this home.
Original Mortgage
$133,941
Interest Rate
6.25%
Mortgage Type
FHA
Purchase Details
Closed on
Jul 6, 1998
Sold by
Jones Lois N
Bought by
Koepfer John and Koepfer Shannon
Home Financials for this Owner
Home Financials are based on the most recent Mortgage that was taken out on this home.
Original Mortgage
$85,600
Interest Rate
6.9%
Create a Home Valuation Report for This Property
The Home Valuation Report is an in-depth analysis detailing your home's value as well as a comparison with similar homes in the area
Home Values in the Area
Average Home Value in this Area
Purchase History
| Date | Buyer | Sale Price | Title Company |
|---|---|---|---|
| Mason Dawn | $207,000 | -- | |
| Kinsey Tara L | $135,000 | Homestead Title Agency | |
| Koepfer John | $107,000 | -- |
Source: Public Records
Mortgage History
| Date | Status | Borrower | Loan Amount |
|---|---|---|---|
| Open | Mason Dawn | $165,000 | |
| Previous Owner | Kinsey Tara L | $133,941 | |
| Previous Owner | Koepfer John | $85,600 |
Source: Public Records
Tax History Compared to Growth
Tax History
| Year | Tax Paid | Tax Assessment Tax Assessment Total Assessment is a certain percentage of the fair market value that is determined by local assessors to be the total taxable value of land and additions on the property. | Land | Improvement |
|---|---|---|---|---|
| 2025 | $6,771 | $165,400 | $30,400 | $135,000 |
| 2024 | $6,530 | $165,400 | $30,400 | $135,000 |
| 2023 | $6,530 | $165,400 | $30,400 | $135,000 |
| 2022 | $6,373 | $165,400 | $30,400 | $135,000 |
| 2021 | $6,011 | $165,400 | $30,400 | $135,000 |
| 2020 | $6,247 | $165,400 | $30,400 | $135,000 |
| 2019 | $6,011 | $165,400 | $30,400 | $135,000 |
| 2018 | $5,923 | $165,400 | $30,400 | $135,000 |
| 2017 | $5,165 | $165,400 | $30,400 | $135,000 |
| 2016 | $4,944 | $165,400 | $30,400 | $135,000 |
| 2015 | $4,626 | $165,400 | $30,400 | $135,000 |
| 2014 | $4,575 | $165,400 | $30,400 | $135,000 |
Source: Public Records
Map
Nearby Homes
- 316 Broad St
- 308 Broad St
- 416 Broad St
- 430 Front St
- 212 Broad St
- 95 Park Ave
- 520 S Main St
- 76 Chestnut St
- 217 S Main St
- 617 Lower Mill Rd
- 211 213 S Main St
- 315 S Main St
- 152 N Main St
- 310 N Main St
- 51 Laurel Ave
- 337 Harding Hwy
- 0 00011 04 Lawrence Corner Rd
- 0 00011 03 Lawrence Corner Rd
- 0 00011 02 Lawrence Corner Rd
- 265 Harding Hwy