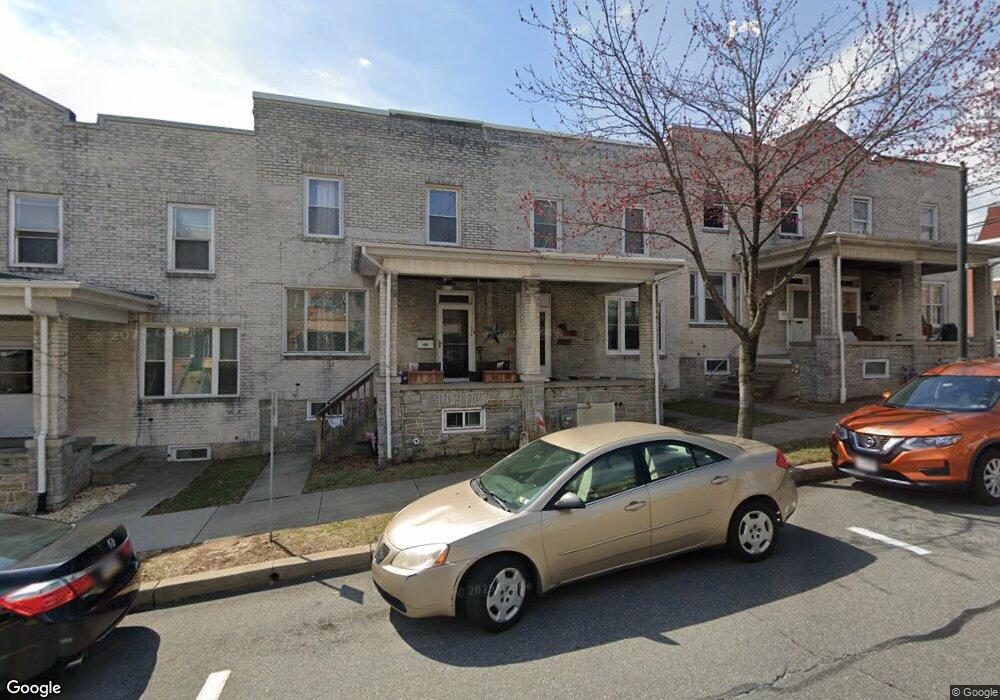
336 Chestnut St West Reading, PA 19611
Estimated Value: $213,427 - $241,000
3
Beds
2
Baths
1,008
Sq Ft
$223/Sq Ft
Est. Value
About This Home
This home is located at 336 Chestnut St, West Reading, PA 19611 and is currently estimated at $224,857, approximately $223 per square foot. 336 Chestnut St is a home located in Berks County with nearby schools including West Reading Elementary Center, Wyomissing Hills Elementary Center, and Wyomissing Area Junior-Senior High School.
Ownership History
Date
Name
Owned For
Owner Type
Purchase Details
Closed on
Aug 23, 2021
Sold by
Williams David Lee
Bought by
Torres Elliot D
Current Estimated Value
Home Financials for this Owner
Home Financials are based on the most recent Mortgage that was taken out on this home.
Original Mortgage
$154,660
Interest Rate
3.09%
Mortgage Type
FHA
Purchase Details
Closed on
Jan 26, 2007
Sold by
Noon Ruth E and Noon Michael J
Bought by
Williams David Lee
Home Financials for this Owner
Home Financials are based on the most recent Mortgage that was taken out on this home.
Original Mortgage
$99,116
Interest Rate
6.22%
Mortgage Type
FHA
Purchase Details
Closed on
Jun 5, 2006
Sold by
Noon Michael J and Kramer Linda L
Bought by
Noon Ruth E
Purchase Details
Closed on
Dec 24, 2004
Sold by
Noon Ruth E
Bought by
Noon Michael J and Kramer Linda L
Create a Home Valuation Report for This Property
The Home Valuation Report is an in-depth analysis detailing your home's value as well as a comparison with similar homes in the area
Home Values in the Area
Average Home Value in this Area
Purchase History
| Date | Buyer | Sale Price | Title Company |
|---|---|---|---|
| Torres Elliot D | $160,000 | Diana Edwards Sentry Abstrac | |
| Williams David Lee | $99,900 | None Available | |
| Noon Ruth E | -- | None Available | |
| Noon Michael J | -- | -- |
Source: Public Records
Mortgage History
| Date | Status | Borrower | Loan Amount |
|---|---|---|---|
| Previous Owner | Torres Elliot D | $154,660 | |
| Previous Owner | Williams David Lee | $99,116 |
Source: Public Records
Tax History Compared to Growth
Tax History
| Year | Tax Paid | Tax Assessment Tax Assessment Total Assessment is a certain percentage of the fair market value that is determined by local assessors to be the total taxable value of land and additions on the property. | Land | Improvement |
|---|---|---|---|---|
| 2025 | $1,156 | $51,100 | $14,900 | $36,200 |
| 2024 | $2,824 | $51,100 | $14,900 | $36,200 |
| 2023 | $1,875 | $51,100 | $14,900 | $36,200 |
| 2022 | $2,621 | $51,100 | $14,900 | $36,200 |
| 2021 | $2,576 | $51,100 | $14,900 | $36,200 |
| 2020 | $2,501 | $51,100 | $14,900 | $36,200 |
| 2019 | $2,449 | $51,100 | $14,900 | $36,200 |
| 2018 | $2,380 | $51,100 | $14,900 | $36,200 |
| 2017 | $2,327 | $51,100 | $14,900 | $36,200 |
| 2016 | $750 | $51,100 | $14,900 | $36,200 |
| 2015 | $750 | $51,100 | $14,900 | $36,200 |
| 2014 | $725 | $51,100 | $14,900 | $36,200 |
Source: Public Records
Map
Nearby Homes
- 330 Kline St
- 245 Chestnut St
- 220 S 2nd Ave
- 206 Chestnut St
- 415 Franklin St
- 331 Sunset Rd
- 529 Chestnut St
- 406 Reading Ave
- 126 S 6th Ave
- 149 Tulpehocken Ave
- 409 Walnut St
- 218 Silk Dr
- 305 Tulpehocken Ave
- 105 S Park Rd
- 267 N Front St
- 233 Pear St
- 21 S 3rd St
- 430 W Greenwich St
- 305 N Front St
- 518 Gordon St
- 338 Chestnut St
- 334 Chestnut St
- 340 Chestnut St
- 332 Chestnut St
- 330 Chestnut St
- 342 Chestnut St
- 328 Chestnut St
- 213 S 4th Ave
- 326 Chestnut St
- 329 Kline St
- 324 Chestnut St
- 327 Kline St
- 325 Kline St
- 322 Chestnut St
- 323 Kline St
- 320 Chestnut St
- 400 Chestnut St
- 321 Kline St
- 221 S 4th Ave
- 318 Chestnut St