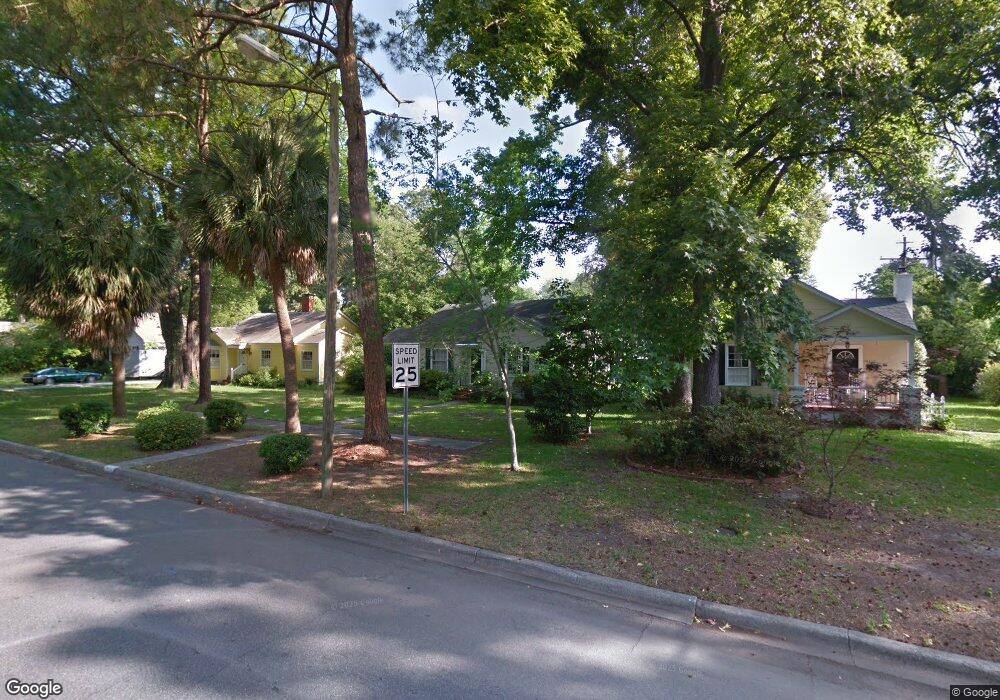
336 E 60th St Savannah, GA 31405
Ardmore-Gould Estates-Olin Heights NeighborhoodEstimated Value: $295,620 - $401,000
3
Beds
1
Bath
1,074
Sq Ft
$332/Sq Ft
Est. Value
About This Home
This home is located at 336 E 60th St, Savannah, GA 31405 and is currently estimated at $356,405, approximately $331 per square foot. 336 E 60th St is a home located in Chatham County with nearby schools including Jacob G. Smith Elementary School, Myers Middle School, and Beach High School.
Ownership History
Date
Name
Owned For
Owner Type
Purchase Details
Closed on
Sep 29, 2006
Sold by
Not Provided
Bought by
Garland Cynthia Y
Current Estimated Value
Home Financials for this Owner
Home Financials are based on the most recent Mortgage that was taken out on this home.
Original Mortgage
$133,000
Outstanding Balance
$78,924
Interest Rate
6.36%
Mortgage Type
New Conventional
Estimated Equity
$277,481
Create a Home Valuation Report for This Property
The Home Valuation Report is an in-depth analysis detailing your home's value as well as a comparison with similar homes in the area
Home Values in the Area
Average Home Value in this Area
Purchase History
| Date | Buyer | Sale Price | Title Company |
|---|---|---|---|
| Garland Cynthia Y | $140,000 | -- |
Source: Public Records
Mortgage History
| Date | Status | Borrower | Loan Amount |
|---|---|---|---|
| Open | Garland Cynthia Y | $133,000 |
Source: Public Records
Tax History Compared to Growth
Tax History
| Year | Tax Paid | Tax Assessment Tax Assessment Total Assessment is a certain percentage of the fair market value that is determined by local assessors to be the total taxable value of land and additions on the property. | Land | Improvement |
|---|---|---|---|---|
| 2025 | $2,046 | $103,360 | $34,560 | $68,800 |
| 2024 | $2,046 | $103,160 | $34,560 | $68,600 |
| 2023 | $806 | $93,240 | $31,320 | $61,920 |
| 2022 | $887 | $72,680 | $16,200 | $56,480 |
| 2021 | $2,535 | $65,280 | $16,200 | $49,080 |
| 2020 | $1,767 | $64,680 | $16,200 | $48,480 |
| 2019 | $2,605 | $65,200 | $16,200 | $49,000 |
| 2018 | $1,666 | $59,840 | $16,200 | $43,640 |
| 2017 | $1,481 | $56,840 | $16,200 | $40,640 |
| 2016 | $1,309 | $51,160 | $16,200 | $34,960 |
| 2015 | $1,996 | $52,280 | $16,320 | $35,960 |
| 2014 | $2,661 | $52,960 | $0 | $0 |
Source: Public Records
Map
Nearby Homes