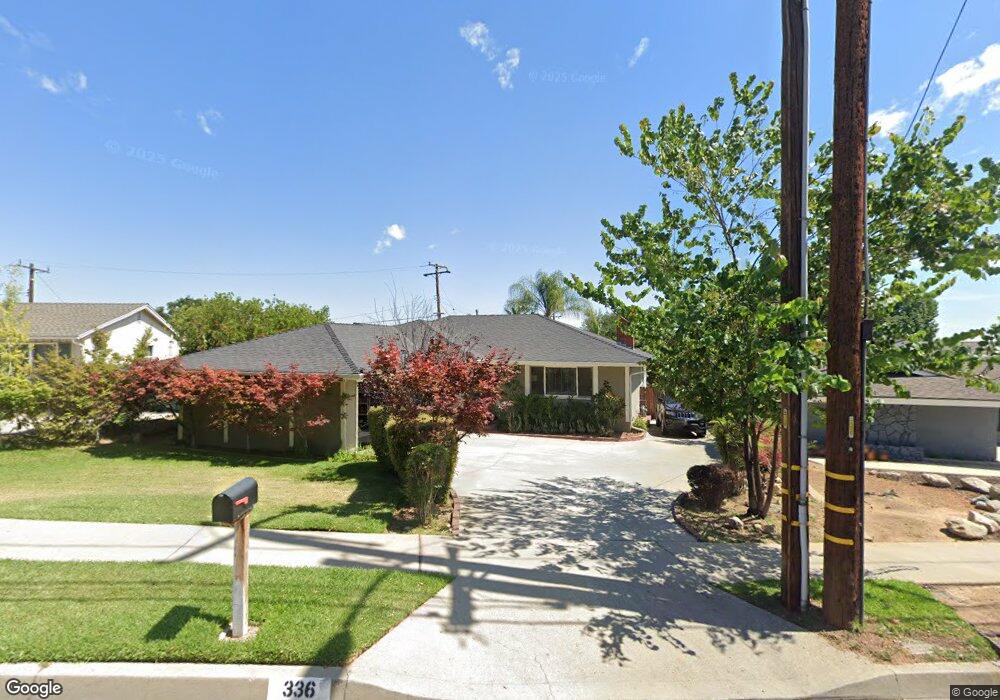
336 E Hillcrest Blvd Monrovia, CA 91016
Estimated Value: $1,134,000 - $1,322,000
3
Beds
2
Baths
1,545
Sq Ft
$790/Sq Ft
Est. Value
About This Home
This home is located at 336 E Hillcrest Blvd, Monrovia, CA 91016 and is currently estimated at $1,220,849, approximately $790 per square foot. 336 E Hillcrest Blvd is a home located in Los Angeles County with nearby schools including Wild Rose Elementary School, Clifton Middle School, and Monrovia High School.
Ownership History
Date
Name
Owned For
Owner Type
Purchase Details
Closed on
Jun 7, 2025
Sold by
Jones Gregory and Jones Alexzaundra
Bought by
Jones Family Trust and Jones
Current Estimated Value
Purchase Details
Closed on
Mar 2, 2018
Sold by
Brown Warren S
Bought by
Jones Gregory and Jones Alexzaundra
Home Financials for this Owner
Home Financials are based on the most recent Mortgage that was taken out on this home.
Original Mortgage
$450,000
Interest Rate
4.38%
Mortgage Type
VA
Purchase Details
Closed on
Oct 15, 2003
Sold by
Sims Leonard J and Sims Nancy W
Bought by
Brown Warren S
Home Financials for this Owner
Home Financials are based on the most recent Mortgage that was taken out on this home.
Original Mortgage
$322,700
Interest Rate
5.72%
Mortgage Type
Purchase Money Mortgage
Create a Home Valuation Report for This Property
The Home Valuation Report is an in-depth analysis detailing your home's value as well as a comparison with similar homes in the area
Home Values in the Area
Average Home Value in this Area
Purchase History
| Date | Buyer | Sale Price | Title Company |
|---|---|---|---|
| Jones Family Trust | -- | None Listed On Document | |
| Jones Gregory | $450,000 | Orange Coast Title Company | |
| Brown Warren S | $450,000 | Southland Title Corporation |
Source: Public Records
Mortgage History
| Date | Status | Borrower | Loan Amount |
|---|---|---|---|
| Previous Owner | Jones Gregory | $450,000 | |
| Previous Owner | Brown Warren S | $322,700 | |
| Closed | Brown Warren S | $37,300 |
Source: Public Records
Tax History
| Year | Tax Paid | Tax Assessment Tax Assessment Total Assessment is a certain percentage of the fair market value that is determined by local assessors to be the total taxable value of land and additions on the property. | Land | Improvement |
|---|---|---|---|---|
| 2025 | $12,714 | $967,151 | $568,913 | $398,238 |
| 2024 | $12,714 | $948,188 | $557,758 | $390,430 |
| 2023 | $12,419 | $929,597 | $546,822 | $382,775 |
| 2022 | $12,055 | $911,370 | $536,100 | $375,270 |
| 2021 | $11,909 | $893,501 | $525,589 | $367,912 |
| 2019 | $11,334 | $867,000 | $510,000 | $357,000 |
| 2018 | $7,495 | $571,714 | $449,840 | $121,874 |
| 2016 | $7,203 | $549,516 | $432,373 | $117,143 |
| 2015 | $7,045 | $541,263 | $425,879 | $115,384 |
| 2014 | $6,971 | $530,661 | $417,537 | $113,124 |
Source: Public Records
Map
Nearby Homes
- 376 Hill St
- 426 N Canyon Blvd
- 214 Canyon Crest Dr
- 208 Canyon Crest Dr
- 378 N Myrtle Ave
- 319 N Encinitas Ave
- 348 N Mountain Ave
- 347 Stedman Place
- 633 Norumbega Dr
- 179 N Ivy Ave
- 149 Grand Ave
- 1069 Briarcliff Rd
- 549 Norumbega Dr
- 250 N Primrose Ave
- 1091 Briarcliff Rd
- 132 Poinsettia Ave
- 976 Ridgeside Dr
- 34 Hidden Valley Rd
- 223 N Mountain Ave
- 785 Norumbega Dr
- 332 E Hillcrest Blvd
- 340 E Hillcrest Blvd
- 405 Hill St
- 328 E Hillcrest Blvd
- 344 E Hillcrest Blvd
- 425 Granite Ave
- 366 Longford Place
- 368 Longford Place
- 355 E Hillcrest Blvd
- 324 E Hillcrest Blvd
- 348 E Hillcrest Blvd
- 433 Granite Ave
- 321 E Hillcrest Blvd
- 413 Hill St
- 343 E Hillcrest Blvd
- 377 Hill St
- 384 Pine Tree Ln
- 431 Todd Ln
- 364 Longford Place
Your Personal Tour Guide
Ask me questions while you tour the home.