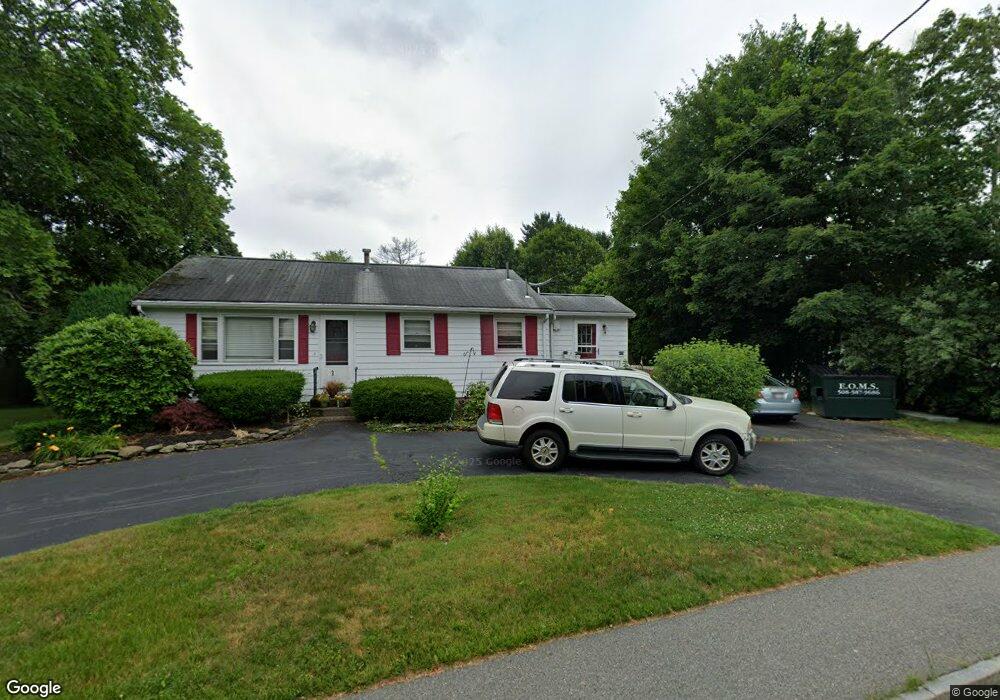
336 Elm St East Bridgewater, MA 02333
Estimated Value: $471,000 - $556,000
3
Beds
2
Baths
1,458
Sq Ft
$353/Sq Ft
Est. Value
About This Home
This home is located at 336 Elm St, East Bridgewater, MA 02333 and is currently estimated at $515,106, approximately $353 per square foot. 336 Elm St is a home located in Plymouth County with nearby schools including Central Elementary School, Gordon W Mitchell Middle School, and East Bridgewater Jr./Sr. High School.
Ownership History
Date
Name
Owned For
Owner Type
Purchase Details
Closed on
Nov 30, 2006
Sold by
Benvissuto Ft
Bought by
Wallace John W and Wallace Sandra J
Current Estimated Value
Home Financials for this Owner
Home Financials are based on the most recent Mortgage that was taken out on this home.
Original Mortgage
$244,000
Outstanding Balance
$146,286
Interest Rate
6.36%
Mortgage Type
Purchase Money Mortgage
Estimated Equity
$368,820
Purchase Details
Closed on
Dec 31, 2003
Sold by
Benvissuto Robert A and Benvissuto Alice C
Bought by
Benvissuto Robert A and Benvissuto Alice C
Purchase Details
Closed on
May 5, 1995
Sold by
Peirce Michael S and Peirce Susan G
Bought by
Benvissuto Robert A and Benvissuto Alice C
Create a Home Valuation Report for This Property
The Home Valuation Report is an in-depth analysis detailing your home's value as well as a comparison with similar homes in the area
Home Values in the Area
Average Home Value in this Area
Purchase History
| Date | Buyer | Sale Price | Title Company |
|---|---|---|---|
| Wallace John W | $305,000 | -- | |
| Benvissuto Robert A | -- | -- | |
| Benvissuto Robert A | $120,000 | -- |
Source: Public Records
Mortgage History
| Date | Status | Borrower | Loan Amount |
|---|---|---|---|
| Open | Benvissuto Robert A | $244,000 | |
| Closed | Benvissuto Robert A | $45,700 |
Source: Public Records
Tax History Compared to Growth
Tax History
| Year | Tax Paid | Tax Assessment Tax Assessment Total Assessment is a certain percentage of the fair market value that is determined by local assessors to be the total taxable value of land and additions on the property. | Land | Improvement |
|---|---|---|---|---|
| 2025 | $4,873 | $356,500 | $176,200 | $180,300 |
| 2024 | $4,789 | $346,000 | $169,400 | $176,600 |
| 2023 | $4,787 | $331,300 | $169,400 | $161,900 |
| 2022 | $4,769 | $305,700 | $154,100 | $151,600 |
| 2021 | $4,725 | $277,100 | $148,000 | $129,100 |
| 2020 | $9,016 | $270,600 | $142,400 | $128,200 |
| 2019 | $9,019 | $262,300 | $136,100 | $126,200 |
| 2018 | $8,870 | $245,000 | $136,100 | $108,900 |
| 2017 | $4,063 | $235,200 | $129,800 | $105,400 |
| 2016 | $4,228 | $232,800 | $129,800 | $103,000 |
| 2015 | $4,108 | $231,300 | $128,800 | $102,500 |
| 2014 | $3,945 | $227,100 | $126,100 | $101,000 |
Source: Public Records
Map
Nearby Homes
- 446 Elm St
- 416 Highland St
- 25 Plain St
- 20 Plain St
- 11 Willow Ave
- 22 Water St
- 585 N Bedford St
- 611 N Bedford St
- 11 Harmony Crossing
- 41 Bedford St
- 505 N Central St
- 407 W Union St
- 50 Belmont St
- 848 N Bedford St Phase III
- 848 N Bedford St
- 848 N Bedford St Phase IV
- 848 N
- 282 Spring St
- 71 Church St
- 9 Hemlock Dr