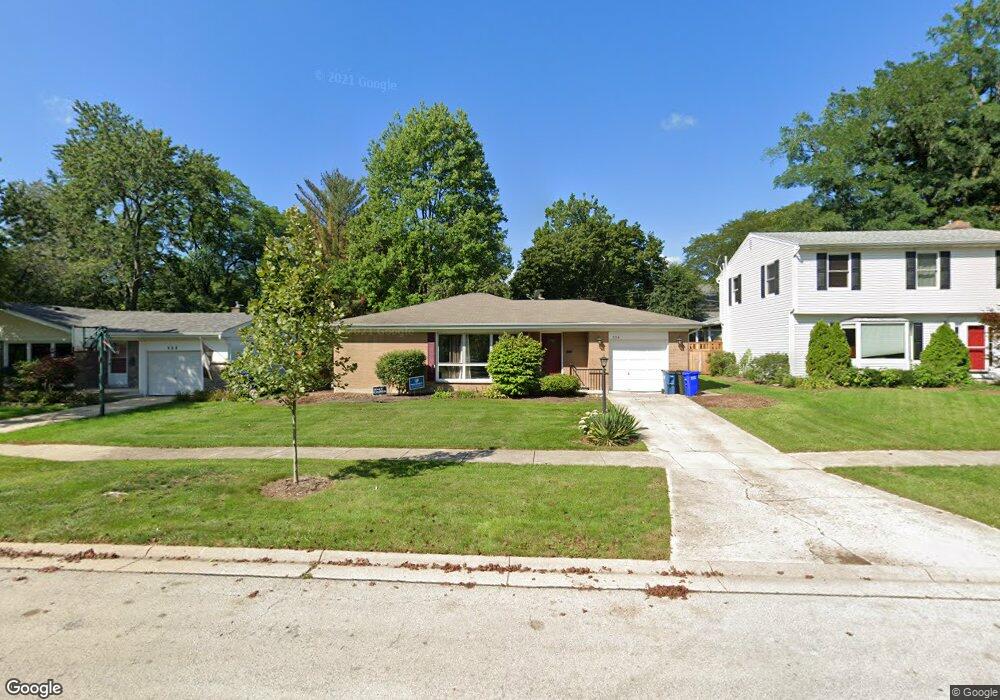
336 Indian Dr Glen Ellyn, IL 60137
Estimated Value: $512,640 - $582,000
4
Beds
2
Baths
1,236
Sq Ft
$451/Sq Ft
Est. Value
About This Home
This home is located at 336 Indian Dr, Glen Ellyn, IL 60137 and is currently estimated at $557,160, approximately $450 per square foot. 336 Indian Dr is a home located in DuPage County with nearby schools including Benjamin Franklin Elementary School, Hadley Junior High School, and Glenbard West High School.
Ownership History
Date
Name
Owned For
Owner Type
Purchase Details
Closed on
Jul 14, 2021
Sold by
Masse Kristen Julia and Stelzer Clay
Bought by
Leger Rodney
Current Estimated Value
Purchase Details
Closed on
May 25, 2016
Sold by
Matakis Kristen
Bought by
Masse Kristen Julia
Home Financials for this Owner
Home Financials are based on the most recent Mortgage that was taken out on this home.
Original Mortgage
$215,000
Interest Rate
3.87%
Mortgage Type
New Conventional
Purchase Details
Closed on
Aug 16, 2011
Sold by
Boyle Angela M and Angela M Boyle Declaration Of
Bought by
Matakis Kristen Julia
Home Financials for this Owner
Home Financials are based on the most recent Mortgage that was taken out on this home.
Original Mortgage
$229,042
Interest Rate
4.37%
Mortgage Type
FHA
Create a Home Valuation Report for This Property
The Home Valuation Report is an in-depth analysis detailing your home's value as well as a comparison with similar homes in the area
Home Values in the Area
Average Home Value in this Area
Purchase History
| Date | Buyer | Sale Price | Title Company |
|---|---|---|---|
| Leger Rodney | $395,000 | Attorneys Ttl Guaranty Fund | |
| Masse Kristen Julia | -- | First American Title Ins Co | |
| Matakis Kristen Julia | $235,000 | Multiple |
Source: Public Records
Mortgage History
| Date | Status | Borrower | Loan Amount |
|---|---|---|---|
| Previous Owner | Masse Kristen Julia | $215,000 | |
| Previous Owner | Matakis Kristen Julia | $229,042 |
Source: Public Records
Tax History Compared to Growth
Tax History
| Year | Tax Paid | Tax Assessment Tax Assessment Total Assessment is a certain percentage of the fair market value that is determined by local assessors to be the total taxable value of land and additions on the property. | Land | Improvement |
|---|---|---|---|---|
| 2024 | $8,789 | $131,019 | $41,587 | $89,432 |
| 2023 | $8,383 | $120,600 | $38,280 | $82,320 |
| 2022 | $8,084 | $113,970 | $36,170 | $77,800 |
| 2021 | $7,771 | $111,260 | $35,310 | $75,950 |
| 2020 | $7,616 | $110,220 | $34,980 | $75,240 |
| 2019 | $7,442 | $107,310 | $34,060 | $73,250 |
| 2018 | $7,540 | $107,820 | $33,560 | $74,260 |
| 2017 | $7,422 | $103,840 | $32,320 | $71,520 |
| 2016 | $7,515 | $99,690 | $31,030 | $68,660 |
| 2015 | $7,490 | $95,100 | $29,600 | $65,500 |
| 2014 | $6,009 | $74,890 | $23,120 | $51,770 |
| 2013 | $5,851 | $75,120 | $23,190 | $51,930 |
Source: Public Records
Map
Nearby Homes
- 924 Waverly Rd
- 953 Oxford Rd
- 449 Longfellow Ave
- 14931 Parkview Blvd
- 153 Grove Ave
- 789 Hill Ave
- 243 Bryant Ave
- 564 W Harrison Rd
- 874 Walnut St
- 397 Taylor Ave
- 130 Tanglewood Dr
- 734 Highview Ave
- 82 Valley Rd
- 61 Grove Ave
- 625 Midway Park
- 408 S Miller Ct
- 855 Crescent Blvd
- 843 Crescent Blvd
- 670 Revere Rd
- 606 Lakeview Terrace