336 N 110th St Apache Junction, AZ 85120
Northeast Mesa NeighborhoodEstimated Value: $326,000 - $400,412
1
Bed
1
Bath
750
Sq Ft
$490/Sq Ft
Est. Value
About This Home
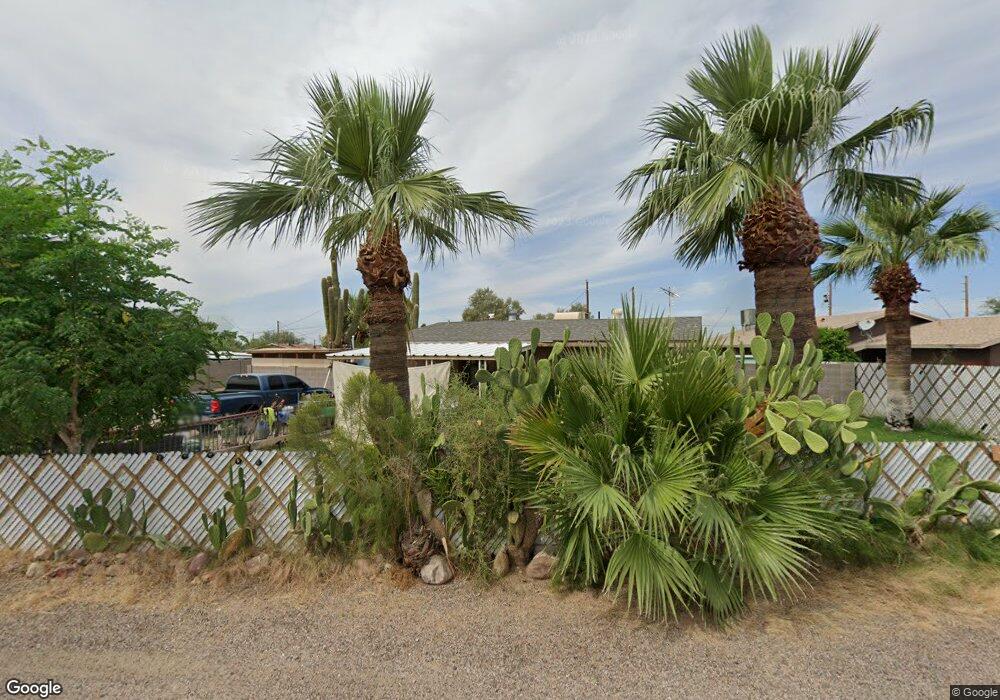
This home is located at 336 N 110th St, Apache Junction, AZ 85120 and is currently estimated at $367,603, approximately $490 per square foot. 336 N 110th St is a home with nearby schools including Sousa Elementary School, Franklin at Brimhall Elementary School, and Franklin West Elementary School.
Ownership History
Date
Name
Owned For
Owner Type
Purchase Details
Closed on
Jan 14, 2022
Sold by
Dennis Earl and Misterious Dawn
Bought by
Dennis Earl and Dennis Misterious Dawn
Current Estimated Value
Home Financials for this Owner
Home Financials are based on the most recent Mortgage that was taken out on this home.
Original Mortgage
$203,500
Outstanding Balance
$187,551
Interest Rate
3.11%
Mortgage Type
FHA
Estimated Equity
$180,052
Purchase Details
Closed on
Mar 19, 2010
Sold by
Villagomez Salvador Ayala and Chavez Crysal Ann
Bought by
Federal National Mortgage Association
Purchase Details
Closed on
Aug 10, 2005
Sold by
Rogers Walter Charles and Rogers Julia Smith
Bought by
Rogers Thomas K and Rogers Mindy K
Purchase Details
Closed on
Oct 6, 2004
Sold by
Rogers Thomas K and Rogers Mindy K
Bought by
Rogers Walter Charles and Rogers Julia Smith
Create a Home Valuation Report for This Property
The Home Valuation Report is an in-depth analysis detailing your home's value as well as a comparison with similar homes in the area
Home Values in the Area
Average Home Value in this Area
Purchase History
| Date | Buyer | Sale Price | Title Company |
|---|---|---|---|
| Dennis Earl | -- | New Title Company Name | |
| Federal National Mortgage Association | $106,195 | First American Title | |
| Rogers Thomas K | -- | -- | |
| Rogers Walter Charles | -- | Tsa Title Agency |
Source: Public Records
Mortgage History
| Date | Status | Borrower | Loan Amount |
|---|---|---|---|
| Open | Dennis Earl | $203,500 |
Source: Public Records
Tax History
| Year | Tax Paid | Tax Assessment Tax Assessment Total Assessment is a certain percentage of the fair market value that is determined by local assessors to be the total taxable value of land and additions on the property. | Land | Improvement |
|---|---|---|---|---|
| 2025 | $748 | $10,028 | -- | -- |
| 2024 | $765 | $9,550 | -- | -- |
| 2023 | $765 | $29,930 | $5,980 | $23,950 |
| 2022 | $745 | $21,180 | $4,230 | $16,950 |
| 2021 | $753 | $18,480 | $3,690 | $14,790 |
| 2020 | $748 | $16,270 | $3,250 | $13,020 |
| 2019 | $685 | $15,100 | $3,020 | $12,080 |
| 2018 | $667 | $13,520 | $2,700 | $10,820 |
| 2017 | $642 | $12,450 | $2,490 | $9,960 |
| 2016 | $628 | $13,030 | $2,600 | $10,430 |
Source: Public Records
Map
Nearby Homes
- 433 N 111th Place
- 345 N Signal Butte Rd Unit 23
- 538 N 110th St
- 10813 E Boston St
- 11201 E Jupiter Dr
- 535 N Bailey Cir
- 11058 E Cholla Rd
- 11029 E Decatur St
- 11237 E Jupiter Dr
- 456 N Opal
- 11252 E Boise St
- 11100 E Apache Trail Unit 37
- 11100 E Apache Trail
- 11100 E Apache Trail Unit 8
- 11100 E Apache Trail Unit 16
- 11100 E Apache Trail Unit 48
- 10936 E Apache Trail Unit 121
- 53 N Mountain Rd Unit 75
- 10620 E Caballero St
- 11340 E Caballero St
- 336 N 110th St Unit 332
- 342 N 110th St
- 332 N 110th St
- 330 N 110th St
- 335 N Dewey St
- 331 N Dewey St
- 346 N 110th St
- 341 N Dewey St
- 324 N 110th St
- 325 N Dewey St
- 345 N Dewey St
- 356 N 110th St
- 321 N Dewey St
- 316 N 110th St
- 315 N Dewey St Unit 5
- 315 N Dewey St
- 355 N Dewey St
- 312 N 110th St
- 352 N Dewey St
- 352 N Dewey St
Your Personal Tour Guide
Ask me questions while you tour the home.