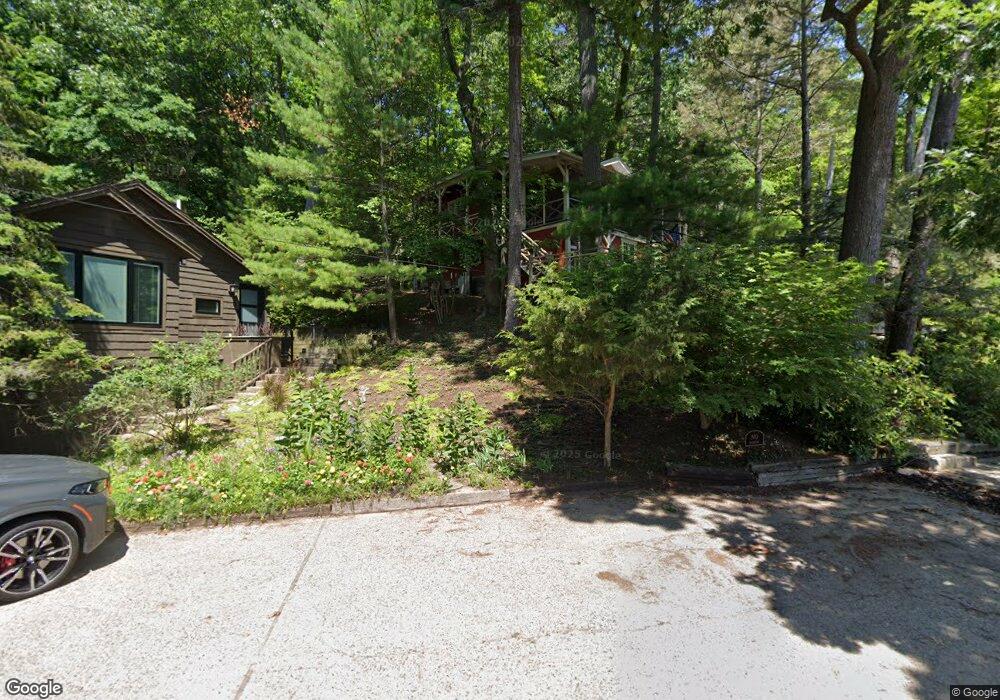
336 Park St Saugatuck, MI 49453
Estimated Value: $867,000 - $1,169,000
3
Beds
2
Baths
1,400
Sq Ft
$725/Sq Ft
Est. Value
About This Home
This home is located at 336 Park St, Saugatuck, MI 49453 and is currently estimated at $1,014,651, approximately $724 per square foot. 336 Park St is a home located in Allegan County with nearby schools including Douglas Elementary School, Saugatuck Middle School, and Saugatuck High School.
Ownership History
Date
Name
Owned For
Owner Type
Purchase Details
Closed on
Aug 5, 2022
Sold by
Richard Sinchak Jason and Richard Ann Erica
Bought by
Jrea Holdings Llc
Current Estimated Value
Purchase Details
Closed on
Dec 9, 2020
Sold by
Debbink Steven J and Debbink Steven J
Bought by
Sinchak Jason Richard and Sinchak Erica Ann
Home Financials for this Owner
Home Financials are based on the most recent Mortgage that was taken out on this home.
Original Mortgage
$367,500
Interest Rate
2.7%
Mortgage Type
New Conventional
Purchase Details
Closed on
Mar 22, 2014
Sold by
Debbink Steven J
Bought by
Debbink Steven J
Purchase Details
Closed on
Aug 10, 2001
Sold by
Rumbler William R and Rumbler Sandra L
Bought by
Debbink Steven J
Home Financials for this Owner
Home Financials are based on the most recent Mortgage that was taken out on this home.
Original Mortgage
$140,000
Interest Rate
6.75%
Purchase Details
Closed on
Jan 12, 1995
Sold by
Rumbler William and Rumbler Sandra
Create a Home Valuation Report for This Property
The Home Valuation Report is an in-depth analysis detailing your home's value as well as a comparison with similar homes in the area
Home Values in the Area
Average Home Value in this Area
Purchase History
| Date | Buyer | Sale Price | Title Company |
|---|---|---|---|
| Jrea Holdings Llc | -- | Us Deeds Pa | |
| Sinchak Jason Richard | $490,000 | Lighthouse Title Inc | |
| Debbink Steven J | -- | None Available | |
| Debbink Steven J | $175,000 | Chicago Title Of Michigan In | |
| -- | $203,000 | -- | |
| -- | $203,000 | -- |
Source: Public Records
Mortgage History
| Date | Status | Borrower | Loan Amount |
|---|---|---|---|
| Previous Owner | Sinchak Jason Richard | $367,500 | |
| Previous Owner | Debbink Steven J | $140,000 |
Source: Public Records
Tax History Compared to Growth
Tax History
| Year | Tax Paid | Tax Assessment Tax Assessment Total Assessment is a certain percentage of the fair market value that is determined by local assessors to be the total taxable value of land and additions on the property. | Land | Improvement |
|---|---|---|---|---|
| 2025 | $16,207 | $446,500 | $145,900 | $300,600 |
| 2024 | -- | $361,800 | $96,400 | $265,400 |
| 2023 | -- | $337,000 | $89,200 | $247,800 |
| 2022 | $0 | $269,100 | $51,000 | $218,100 |
| 2021 | $7,427 | $240,100 | $52,900 | $187,200 |
| 2020 | $7,427 | $132,000 | $52,900 | $79,100 |
| 2019 | $0 | $175,100 | $76,500 | $98,600 |
| 2018 | $0 | $157,100 | $76,500 | $80,600 |
| 2017 | $0 | $158,800 | $76,500 | $82,300 |
| 2016 | $0 | $119,200 | $76,500 | $42,700 |
| 2015 | -- | $119,200 | $76,500 | $42,700 |
| 2014 | -- | $126,200 | $76,500 | $49,700 |
| 2013 | -- | $119,000 | $76,500 | $42,500 |
Source: Public Records
Map
Nearby Homes
- 293 Sugar Hill Ct Unit 2
- VL Park St
- 292 Sugar Hill Ct Unit 7
- 301 Sugar Hill Ct Unit 4
- 64 Griffith St Unit 17
- 690 Dunegrass Circle Dr
- 417 Spear St
- 873 Park St
- 345 Dunegrass Ridge Dr
- 225 Dunegrass Ridge Dr
- 582 Campbell Rd
- 660 Lake St
- 678 Lake St
- VL Lake St
- 790 Lake St
- 149 Taylor St
- 212 N Maple St
- 134 Saint Peters Dr Unit 6
- 166 Saint Peters Dr Unit 2
- 150 Saint Peters Dr Unit 4