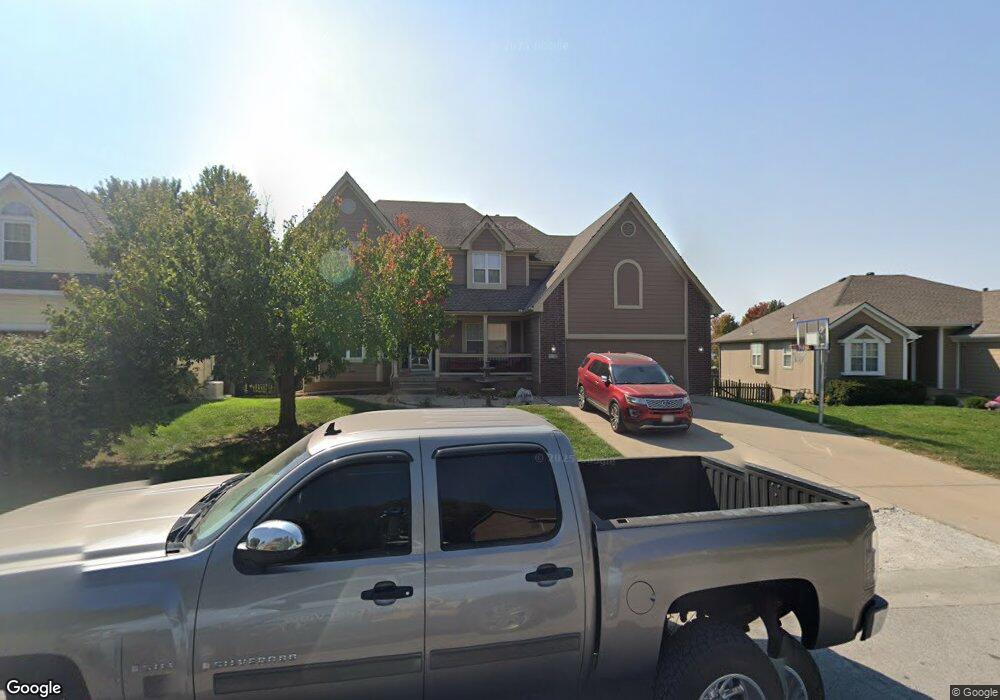
336 SE Bingham Dr Lees Summit, MO 64063
Estimated Value: $416,409 - $518,000
5
Beds
4
Baths
2,246
Sq Ft
$204/Sq Ft
Est. Value
About This Home
This home is located at 336 SE Bingham Dr, Lees Summit, MO 64063 and is currently estimated at $459,102, approximately $204 per square foot. 336 SE Bingham Dr is a home located in Jackson County with nearby schools including Highland Park Elementary School, Pleasant Lea Middle School, and Lee's Summit Senior High School.
Ownership History
Date
Name
Owned For
Owner Type
Purchase Details
Closed on
Apr 20, 2022
Sold by
Bethard Robert Mark
Bought by
Bethard Robert Mark and Bethard Jennifer Ann
Current Estimated Value
Purchase Details
Closed on
Jun 20, 2013
Sold by
Noe Steven and Noe Nina A
Bought by
Bethard Robert M
Home Financials for this Owner
Home Financials are based on the most recent Mortgage that was taken out on this home.
Original Mortgage
$213,839
Interest Rate
3.63%
Mortgage Type
FHA
Purchase Details
Closed on
May 20, 1996
Sold by
Mcgovern Builders Inc
Bought by
Noe Steven and Noe Nina A
Home Financials for this Owner
Home Financials are based on the most recent Mortgage that was taken out on this home.
Original Mortgage
$151,600
Interest Rate
7.93%
Mortgage Type
Purchase Money Mortgage
Create a Home Valuation Report for This Property
The Home Valuation Report is an in-depth analysis detailing your home's value as well as a comparison with similar homes in the area
Home Values in the Area
Average Home Value in this Area
Purchase History
| Date | Buyer | Sale Price | Title Company |
|---|---|---|---|
| Bethard Robert Mark | -- | None Listed On Document | |
| Bethard Robert M | -- | Omega Title Services Llc | |
| Noe Steven | -- | Coffelt Land Title Inc |
Source: Public Records
Mortgage History
| Date | Status | Borrower | Loan Amount |
|---|---|---|---|
| Previous Owner | Bethard Robert M | $213,839 | |
| Previous Owner | Noe Steven | $151,600 |
Source: Public Records
Tax History
| Year | Tax Paid | Tax Assessment Tax Assessment Total Assessment is a certain percentage of the fair market value that is determined by local assessors to be the total taxable value of land and additions on the property. | Land | Improvement |
|---|---|---|---|---|
| 2025 | $5,545 | $64,577 | $12,633 | $51,944 |
| 2024 | $5,545 | $76,792 | $8,269 | $68,523 |
| 2023 | $5,505 | $76,792 | $10,387 | $66,405 |
| 2022 | $3,942 | $48,830 | $7,382 | $41,448 |
| 2021 | $4,023 | $48,830 | $7,382 | $41,448 |
| 2020 | $3,873 | $46,551 | $7,382 | $39,169 |
| 2019 | $3,767 | $53,439 | $7,382 | $46,057 |
| 2018 | $3,964 | $45,448 | $4,198 | $41,250 |
| 2017 | $3,964 | $45,448 | $4,198 | $41,250 |
| 2016 | $3,699 | $41,978 | $6,850 | $35,128 |
| 2014 | $3,663 | $40,603 | $6,650 | $33,953 |
Source: Public Records
Map
Nearby Homes
- 521 SE Asheville Dr
- 532 SE Asheville Dr
- 503 NE Legacy Wood Cir
- 413 SE Ashton Dr
- 2213 SE 3rd St
- 2205 SE Meeting St
- 312 SE Battery Dr
- 24002 E Langsford Rd
- 505 SE Onyx Dr
- 113 SE Bristol Dr
- 707 NE Sundance Trail
- 2300 NE Silver Spring Ln
- 302 SE Flagstone Dr
- 100 NE Keystone Dr
- 10705 Wildflower Dr
- 116 NE Greystone Dr
- 1724 SE 5th Terrace
- 1604 SE 11th St
- 12416 S Acacia Dr
- 12406 S Acacia Dr
- 332 SE Bingham Dr
- 340 SE Bingham Dr
- 328 SE Bingham Dr
- 2708 SE 4th St
- 2704 SE 4th St
- 344 SE Bingham Dr
- 2700 SE 4th St
- 2712 SE 4th St
- 325 SE Bingham Dr
- 324 SE Bingham Dr
- 324 SE Breon Bay
- 321 SE Bingham Dr
- 320 SE Breon Bay
- 320 SE Bingham Dr
- 2705 SE 4th St
- 329 SE Breon Bay
- 333 SE Breon Bay
- 317 SE Bingham Dr
- 316 SE Breon Bay
- 2701 SE 4th St
Your Personal Tour Guide
Ask me questions while you tour the home.