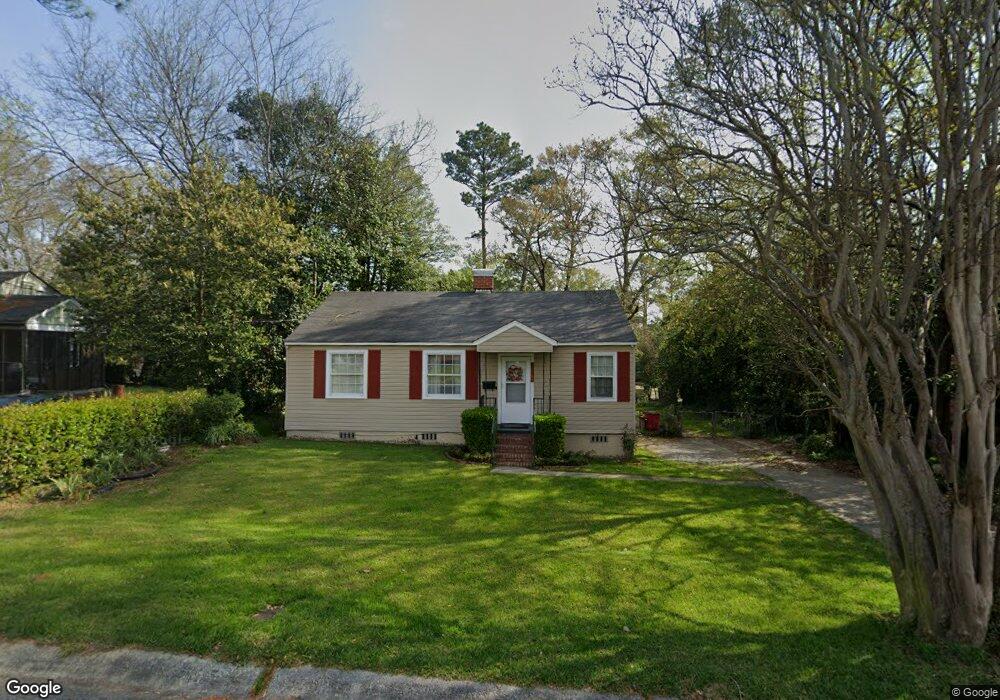
3361 Matheson Dr Macon, GA 31204
Estimated Value: $63,000 - $98,000
2
Beds
1
Bath
1,016
Sq Ft
$75/Sq Ft
Est. Value
About This Home
This home is located at 3361 Matheson Dr, Macon, GA 31204 and is currently estimated at $76,156, approximately $74 per square foot. 3361 Matheson Dr is a home located in Bibb County with nearby schools including Brookdale Elementary School, Howard Middle School, and Howard High School.
Ownership History
Date
Name
Owned For
Owner Type
Purchase Details
Closed on
Jun 29, 2012
Sold by
Chastain Management Group Llc
Bought by
Hugley Oscar L
Current Estimated Value
Home Financials for this Owner
Home Financials are based on the most recent Mortgage that was taken out on this home.
Original Mortgage
$41,172
Outstanding Balance
$5,824
Interest Rate
3.83%
Mortgage Type
Seller Take Back
Estimated Equity
$70,332
Purchase Details
Closed on
Dec 4, 2008
Sold by
Johnson Joe
Bought by
Chastain Management Group Llc
Purchase Details
Closed on
May 6, 2008
Sold by
Boston Sonnya D
Bought by
Everhome Mortgage Co
Purchase Details
Closed on
Feb 27, 2006
Sold by
Luckie Susan L
Bought by
Boston Sonnya D
Home Financials for this Owner
Home Financials are based on the most recent Mortgage that was taken out on this home.
Original Mortgage
$45,000
Interest Rate
6.04%
Mortgage Type
New Conventional
Create a Home Valuation Report for This Property
The Home Valuation Report is an in-depth analysis detailing your home's value as well as a comparison with similar homes in the area
Home Values in the Area
Average Home Value in this Area
Purchase History
| Date | Buyer | Sale Price | Title Company |
|---|---|---|---|
| Hugley Oscar L | $40,000 | None Available | |
| Chastain Management Group Llc | -- | None Available | |
| Johnson Joc | -- | None Available | |
| Everhome Mortgage Co | $46,300 | -- | |
| Federal National Mortgage Association | $46,307 | None Available | |
| Everhome Mortgage Co | $46,306 | None Available | |
| Boston Sonnya D | $45,000 | None Available |
Source: Public Records
Mortgage History
| Date | Status | Borrower | Loan Amount |
|---|---|---|---|
| Open | Hugley Oscar L | $41,172 | |
| Previous Owner | Boston Sonnya D | $45,000 |
Source: Public Records
Tax History Compared to Growth
Tax History
| Year | Tax Paid | Tax Assessment Tax Assessment Total Assessment is a certain percentage of the fair market value that is determined by local assessors to be the total taxable value of land and additions on the property. | Land | Improvement |
|---|---|---|---|---|
| 2025 | $143 | $20,389 | $2,640 | $17,749 |
| 2024 | $150 | $20,389 | $2,640 | $17,749 |
| 2023 | $178 | $20,389 | $2,640 | $17,749 |
| 2022 | $36 | $12,988 | $1,404 | $11,584 |
| 2021 | $380 | $10,008 | $1,194 | $8,814 |
| 2020 | $400 | $10,008 | $1,194 | $8,814 |
| 2019 | $400 | $10,008 | $1,194 | $8,814 |
| 2018 | $120 | $10,008 | $1,194 | $8,814 |
| 2017 | $326 | $10,008 | $1,194 | $8,814 |
| 2016 | $0 | $10,007 | $1,194 | $8,814 |
| 2015 | -- | $10,007 | $1,194 | $8,814 |
| 2014 | $145 | $13,719 | $2,387 | $11,332 |
Source: Public Records
Map
Nearby Homes
- 3369 Matheson Dr Unit 6
- 3353 Matheson Dr
- 3328 Atkins Dr
- 3336 Atkins Dr
- 3377 Matheson Dr
- 3345 Matheson Dr
- 3320 Atkins Dr
- 3344 Atkins Dr
- 3368 Matheson Dr
- 3360 Matheson Dr
- 3312 Atkins Dr
- 3380 Matheson Dr
- 3352 Atkins Dr
- 3337 Matheson Dr
- 3385 Matheson Dr
- 3352 Matheson Dr
- 3352 Matheson Dr Unit 4
- 3304 Atkins Dr
- 3364 Atkins Dr
- 3246 Atkins Dr