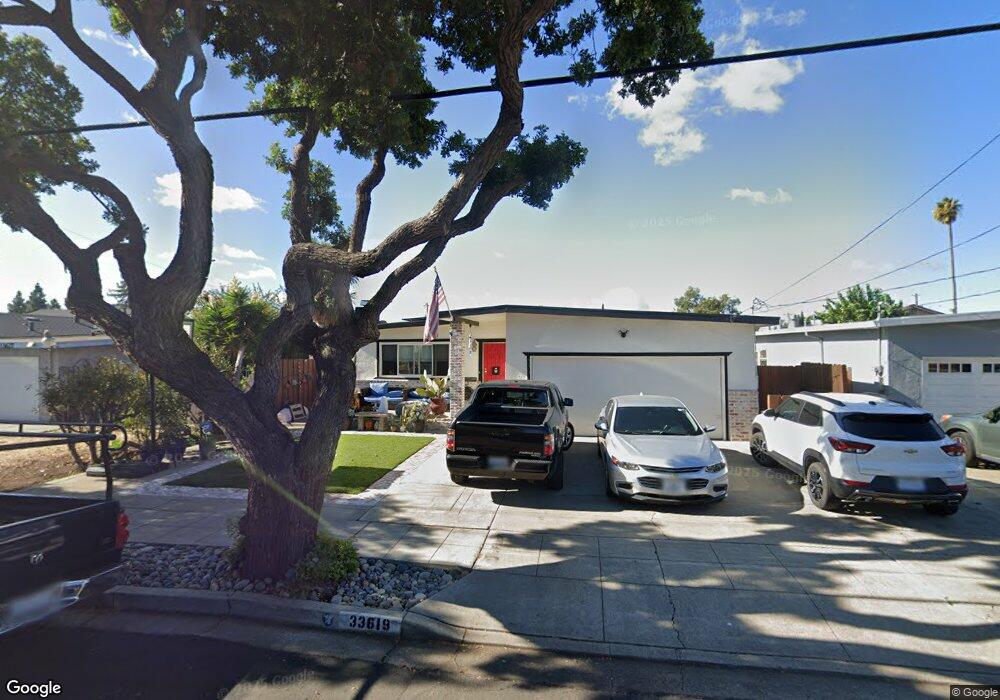
33619 13th St Union City, CA 94587
Downtown Union City NeighborhoodEstimated Value: $937,000 - $1,094,000
3
Beds
2
Baths
1,295
Sq Ft
$768/Sq Ft
Est. Value
About This Home
This home is located at 33619 13th St, Union City, CA 94587 and is currently estimated at $995,175, approximately $768 per square foot. 33619 13th St is a home located in Alameda County with nearby schools including Searles Elementary School, Cesar Chavez Middle School, and James Logan High School.
Ownership History
Date
Name
Owned For
Owner Type
Purchase Details
Closed on
Nov 4, 2004
Sold by
Williams Tina A
Bought by
Williams Richard J
Current Estimated Value
Home Financials for this Owner
Home Financials are based on the most recent Mortgage that was taken out on this home.
Original Mortgage
$195,500
Interest Rate
5.69%
Mortgage Type
New Conventional
Purchase Details
Closed on
Feb 22, 2002
Sold by
Williams Richard J
Bought by
Williams Richard J and Williams Tina A
Home Financials for this Owner
Home Financials are based on the most recent Mortgage that was taken out on this home.
Original Mortgage
$197,000
Interest Rate
6.8%
Purchase Details
Closed on
Jan 16, 1998
Sold by
Williams Richard J and Williams Valerie
Bought by
Williams Richard J
Home Financials for this Owner
Home Financials are based on the most recent Mortgage that was taken out on this home.
Original Mortgage
$136,000
Interest Rate
7.13%
Create a Home Valuation Report for This Property
The Home Valuation Report is an in-depth analysis detailing your home's value as well as a comparison with similar homes in the area
Home Values in the Area
Average Home Value in this Area
Purchase History
| Date | Buyer | Sale Price | Title Company |
|---|---|---|---|
| Williams Richard J | -- | Alliance Title Company | |
| Williams Richard J | -- | Commonwealth Land Title Co | |
| Williams Richard J | -- | First American Title |
Source: Public Records
Mortgage History
| Date | Status | Borrower | Loan Amount |
|---|---|---|---|
| Closed | Williams Richard J | $195,500 | |
| Closed | Williams Richard J | $197,000 | |
| Closed | Williams Richard J | $136,000 | |
| Closed | Williams Richard J | $195,500 |
Source: Public Records
Tax History Compared to Growth
Tax History
| Year | Tax Paid | Tax Assessment Tax Assessment Total Assessment is a certain percentage of the fair market value that is determined by local assessors to be the total taxable value of land and additions on the property. | Land | Improvement |
|---|---|---|---|---|
| 2025 | $3,634 | $166,556 | $71,091 | $95,465 |
| 2024 | $3,634 | $163,291 | $69,697 | $93,594 |
| 2023 | $3,459 | $160,090 | $68,331 | $91,759 |
| 2022 | $3,366 | $156,951 | $66,991 | $89,960 |
| 2021 | $3,290 | $153,874 | $65,678 | $88,196 |
| 2020 | $3,255 | $152,296 | $65,004 | $87,292 |
| 2019 | $3,266 | $149,310 | $63,730 | $85,580 |
| 2018 | $3,185 | $146,382 | $62,480 | $83,902 |
| 2017 | $3,106 | $143,512 | $61,255 | $82,257 |
| 2016 | $2,998 | $140,700 | $60,055 | $80,645 |
| 2015 | $2,933 | $138,587 | $59,153 | $79,434 |
| 2014 | $2,823 | $135,872 | $57,994 | $77,878 |
Source: Public Records
Map
Nearby Homes
- 33721 12th St
- 33528 13th St
- 1870 Sherman Dr
- 33853 10th St
- 33840 10th St
- 902 G St
- 33848 10th St
- 33852 11th St
- 2108 Dalton Way
- 33548 4th St
- 33603 3rd St
- 33718 3rd St
- 1028 Montoya Terrace Unit 2
- 34237 Torrey Pine Ln
- 2404 Maraschino Place
- 136 Tamarack Dr
- 1027 Chalcedony Terrace
- 126 Bellflower Ln
- 2221 Partridge Way Unit 3
- 32306 Ithaca St