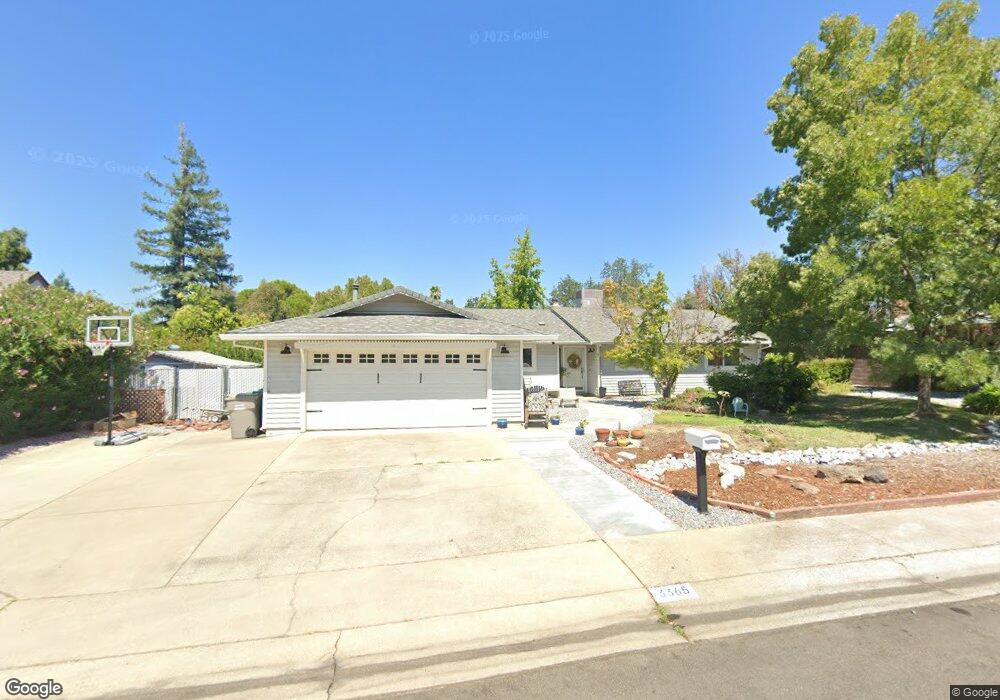
3365 Sherman Way Redding, CA 96003
Panorama NeighborhoodEstimated Value: $337,000 - $372,714
3
Beds
2
Baths
1,558
Sq Ft
$228/Sq Ft
Est. Value
About This Home
This home is located at 3365 Sherman Way, Redding, CA 96003 and is currently estimated at $355,679, approximately $228 per square foot. 3365 Sherman Way is a home located in Shasta County with nearby schools including Rocky Point Charter School.
Ownership History
Date
Name
Owned For
Owner Type
Purchase Details
Closed on
Jul 1, 2024
Sold by
Bohrer Ruth R
Bought by
Miller Rebecca A
Current Estimated Value
Home Financials for this Owner
Home Financials are based on the most recent Mortgage that was taken out on this home.
Original Mortgage
$100,000
Outstanding Balance
$98,322
Interest Rate
7.17%
Mortgage Type
New Conventional
Estimated Equity
$257,357
Purchase Details
Closed on
Jun 3, 2024
Sold by
Parker Family Trust and Parker Peggy Jo
Bought by
Miller Rebecca A and Bohrer Ruth R
Home Financials for this Owner
Home Financials are based on the most recent Mortgage that was taken out on this home.
Original Mortgage
$100,000
Outstanding Balance
$98,322
Interest Rate
7.17%
Mortgage Type
New Conventional
Estimated Equity
$257,357
Purchase Details
Closed on
Feb 8, 2023
Sold by
Parker Peggy J
Bought by
Parker Family Trust and Parker
Create a Home Valuation Report for This Property
The Home Valuation Report is an in-depth analysis detailing your home's value as well as a comparison with similar homes in the area
Home Values in the Area
Average Home Value in this Area
Purchase History
| Date | Buyer | Sale Price | Title Company |
|---|---|---|---|
| Miller Rebecca A | -- | None Listed On Document | |
| Miller Rebecca A | -- | None Listed On Document | |
| Miller Rebecca A | $357,000 | First American Title | |
| Miller Rebecca A | $357,000 | First American Title | |
| Parker Family Trust | -- | None Listed On Document | |
| Parker Family Trust | -- | None Listed On Document |
Source: Public Records
Mortgage History
| Date | Status | Borrower | Loan Amount |
|---|---|---|---|
| Open | Miller Rebecca A | $100,000 |
Source: Public Records
Tax History
| Year | Tax Paid | Tax Assessment Tax Assessment Total Assessment is a certain percentage of the fair market value that is determined by local assessors to be the total taxable value of land and additions on the property. | Land | Improvement |
|---|---|---|---|---|
| 2025 | $1,479 | $364,068 | $76,485 | $287,583 |
| 2024 | $1,449 | $139,580 | $20,687 | $118,893 |
| 2023 | $1,449 | $136,844 | $20,282 | $116,562 |
| 2022 | $1,409 | $134,162 | $19,885 | $114,277 |
| 2021 | $1,389 | $131,533 | $19,496 | $112,037 |
| 2020 | $1,382 | $130,186 | $19,297 | $110,889 |
| 2019 | $1,338 | $127,634 | $18,919 | $108,715 |
| 2018 | $1,337 | $125,133 | $18,549 | $106,584 |
| 2017 | $1,313 | $122,681 | $18,186 | $104,495 |
| 2016 | $1,255 | $120,277 | $17,830 | $102,447 |
| 2015 | $1,234 | $118,472 | $17,563 | $100,909 |
| 2014 | $1,242 | $116,152 | $17,219 | $98,933 |
Source: Public Records
Map
Nearby Homes
- 3605 Tamarack Dr
- 3345 Golden Heights Dr
- 830 Middle St
- 750 Oleta Dr
- 3010 Winding Way
- 836 August Way
- 1070 Dara Ct
- 3588 Magnums Way
- 0 Lake Blvd
- 3041 Panorama Dr
- 3105 Jordan Ln
- 4098 Saint Patricks Ave
- 605 Quartz Hill Rd
- 3586 E Keswick Dam Rd
- 500-550 Quartz Hill Rd
- 1439 Calexico Dr
- 1046 Shawnee Trail Unit 109
- 1450 Calexico Dr
- 1025 Mountain Shadows Blvd
- 1220 Pershing St
- 3365 Sherman Way
- 3340 Sherman Way
- 3615 Tamarack Dr
- 3320 Sherman Way
- 3625 Tamarack Dr
- 3375 Golden Heights Dr
- 3359 Golden Heights Dr
- 3545 Tamarack Dr
- 3360 Sherman Way
- 3600 Tamarack Dr
- 3393 Golden Heights Dr
- 3635 Tamarack Dr
- 3525 Tamarack Dr
- 3345 Golden Heights Dr
- 3317 Sherman Way Unit 1
- 3317 Sherman Way
- 3610 Tamarack Dr
- 3540 Tamarack Dr
- 3645 Tamarack Dr
- 3339 Sherman Way
Your Personal Tour Guide
Ask me questions while you tour the home.