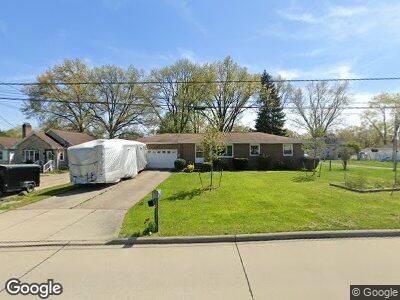
3366 Curtis St Mogadore, OH 44260
Mogadore NeighborhoodEstimated Value: $208,426 - $260,000
3
Beds
2
Baths
1,144
Sq Ft
$197/Sq Ft
Est. Value
About This Home
This home is located at 3366 Curtis St, Mogadore, OH 44260 and is currently estimated at $224,857, approximately $196 per square foot. 3366 Curtis St is a home located in Summit County with nearby schools including O.H. Somers Elementary School, Mogadore High School, and Summit Academy Akron Elementary School.
Ownership History
Date
Name
Owned For
Owner Type
Purchase Details
Closed on
Aug 22, 2002
Sold by
Lynch Garry F
Bought by
Resch Ralph E and Resch Bobbie J
Current Estimated Value
Home Financials for this Owner
Home Financials are based on the most recent Mortgage that was taken out on this home.
Original Mortgage
$128,250
Interest Rate
6.63%
Purchase Details
Closed on
Jul 1, 1999
Sold by
Lynch Brenda S
Bought by
Lynch Garry F
Home Financials for this Owner
Home Financials are based on the most recent Mortgage that was taken out on this home.
Original Mortgage
$104,125
Interest Rate
7.61%
Purchase Details
Closed on
Nov 15, 1995
Sold by
Rowe Marion A
Bought by
Lynch Garry F and Lynch Brenda S
Home Financials for this Owner
Home Financials are based on the most recent Mortgage that was taken out on this home.
Original Mortgage
$82,300
Interest Rate
7.65%
Mortgage Type
New Conventional
Create a Home Valuation Report for This Property
The Home Valuation Report is an in-depth analysis detailing your home's value as well as a comparison with similar homes in the area
Home Values in the Area
Average Home Value in this Area
Purchase History
| Date | Buyer | Sale Price | Title Company |
|---|---|---|---|
| Resch Ralph E | $135,000 | Midland Commerce Group | |
| Lynch Garry F | -- | Minnesota Insured Title Agen | |
| Lynch Garry F | $102,900 | -- |
Source: Public Records
Mortgage History
| Date | Status | Borrower | Loan Amount |
|---|---|---|---|
| Open | Resch Bobbie J | $100,000 | |
| Closed | Resch Ralph E | $77,000 | |
| Closed | Resch Ralph E | $128,250 | |
| Previous Owner | Lynch Garry F | $106,200 | |
| Previous Owner | Lynch Garry F | $104,125 | |
| Previous Owner | Lynch Garry F | $82,300 |
Source: Public Records
Tax History Compared to Growth
Tax History
| Year | Tax Paid | Tax Assessment Tax Assessment Total Assessment is a certain percentage of the fair market value that is determined by local assessors to be the total taxable value of land and additions on the property. | Land | Improvement |
|---|---|---|---|---|
| 2025 | $3,121 | $62,140 | $14,928 | $47,212 |
| 2024 | $3,121 | $62,140 | $14,928 | $47,212 |
| 2023 | $3,121 | $62,140 | $14,928 | $47,212 |
| 2022 | $2,632 | $44,073 | $10,588 | $33,485 |
| 2021 | $2,432 | $44,073 | $10,588 | $33,485 |
| 2020 | $2,529 | $44,080 | $10,590 | $33,490 |
| 2019 | $2,382 | $38,790 | $10,590 | $28,200 |
| 2018 | $2,357 | $38,790 | $10,590 | $28,200 |
| 2017 | $2,355 | $38,790 | $10,590 | $28,200 |
| 2016 | $2,305 | $35,680 | $10,590 | $25,090 |
| 2015 | $2,355 | $35,680 | $10,590 | $25,090 |
| 2014 | $2,101 | $35,680 | $10,590 | $25,090 |
| 2013 | $2,315 | $38,820 | $10,590 | $28,230 |
Source: Public Records
Map
Nearby Homes
- 3365 Herbert St
- 3307 Kole Dr
- 3191 Jaber Dr
- 138 Dangel Ave
- 205 Pocantico Ave
- 23 Shady Acres Dr
- 3667 Louise St
- 285 Stull Ave
- 3012 Albrecht Ave
- 3641 Argonne St
- 3095 Forest Park Blvd
- 3707 Orchard St
- 58 Wilpark Dr
- 431 Lessig Ave
- 0 Gilchrist Rd
- 3745 Orchard St
- 432 Celia Ave
- 526 Columbine Ave
- 3588 Albrecht Ave
- 3742 Argonne St
- 3366 Curtis St
- 3356 Curtis St
- 3374 Curtis St
- 3350 Curtis St
- 3367 Curtis St
- 3369 Herbert St
- 3357 Curtis St
- 3346 Curtis St
- 3390 Curtis St
- 3353 Curtis St
- 3347 Herbert St
- 3383 Curtis St
- 3379 Herbert St
- 3355 Herbert St
- 3339 Herbert St
- 3389 Herbert St
- 3330 Curtis St
- 3375 Curtis St
- 116 Marion Ave
- 120 Marion Ave