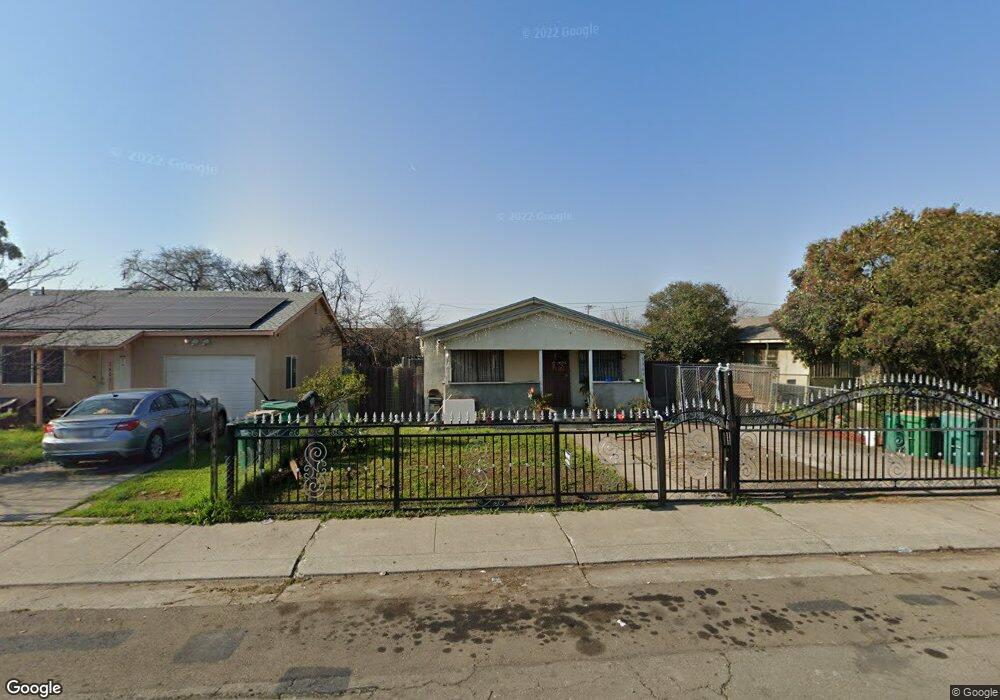
3367 Phelps St Stockton, CA 95206
Kennedy NeighborhoodEstimated Value: $264,000 - $351,000
2
Beds
1
Bath
980
Sq Ft
$302/Sq Ft
Est. Value
About This Home
This home is located at 3367 Phelps St, Stockton, CA 95206 and is currently estimated at $295,740, approximately $301 per square foot. 3367 Phelps St is a home located in San Joaquin County with nearby schools including Van Buren Elementary School, Monroe Elementary School, and Alexander Hamilton Elementary.
Ownership History
Date
Name
Owned For
Owner Type
Purchase Details
Closed on
Mar 21, 2017
Sold by
Cedillo Anayenci Vega and Cedillo Salud Vega
Bought by
Reyes Jose Luis Pina and Cedillo Salud Vega
Current Estimated Value
Purchase Details
Closed on
Aug 27, 2015
Sold by
Cedillo Anayenci Vega
Bought by
Cedillo Anayenci Vega and Cedillo Salud Vega
Purchase Details
Closed on
Jan 5, 2011
Sold by
Wells Fargo Bank National Association
Bought by
Cedillo Anayenci Vega
Purchase Details
Closed on
Oct 6, 2010
Sold by
Nesbitt Jameo and Robinson June R L A
Bought by
Wells Fargo Bank National Association
Purchase Details
Closed on
Jul 19, 2006
Sold by
Terry Ophelia and Edmond Glendean
Bought by
Nesbitt Jameo and Robinson June R L A
Home Financials for this Owner
Home Financials are based on the most recent Mortgage that was taken out on this home.
Original Mortgage
$200,000
Interest Rate
6.8%
Mortgage Type
Balloon
Purchase Details
Closed on
Sep 24, 1998
Sold by
Gladys Brown and Gladys Carl V
Bought by
Terry Ophelia and Edmond Glendean
Create a Home Valuation Report for This Property
The Home Valuation Report is an in-depth analysis detailing your home's value as well as a comparison with similar homes in the area
Home Values in the Area
Average Home Value in this Area
Purchase History
| Date | Buyer | Sale Price | Title Company |
|---|---|---|---|
| Reyes Jose Luis Pina | -- | None Available | |
| Cedillo Anayenci Vega | $26,000 | None Available | |
| Cedillo Anayenci Vega | $48,000 | Lsi Title Company Ca | |
| Wells Fargo Bank National Association | $42,068 | None Available | |
| Nesbitt Jameo | $250,000 | Old Republic Title Company | |
| Terry Ophelia | -- | -- | |
| Terry Ophelia | -- | -- | |
| Terry Ophelia | -- | -- |
Source: Public Records
Mortgage History
| Date | Status | Borrower | Loan Amount |
|---|---|---|---|
| Previous Owner | Nesbitt Jameo | $200,000 |
Source: Public Records
Tax History Compared to Growth
Tax History
| Year | Tax Paid | Tax Assessment Tax Assessment Total Assessment is a certain percentage of the fair market value that is determined by local assessors to be the total taxable value of land and additions on the property. | Land | Improvement |
|---|---|---|---|---|
| 2025 | $1,595 | $127,657 | $52,222 | $75,435 |
| 2024 | $1,570 | $125,155 | $51,199 | $73,956 |
| 2023 | $1,535 | $122,702 | $50,196 | $72,506 |
| 2022 | $1,516 | $120,297 | $49,212 | $71,085 |
| 2021 | $1,457 | $117,940 | $48,248 | $69,692 |
| 2020 | $1,485 | $116,732 | $47,754 | $68,978 |
| 2019 | $1,479 | $114,444 | $46,818 | $67,626 |
| 2018 | $1,452 | $112,200 | $45,900 | $66,300 |
| 2017 | $678 | $52,987 | $13,247 | $39,740 |
| 2016 | $690 | $51,948 | $12,987 | $38,961 |
| 2015 | $599 | $51,168 | $12,792 | $38,376 |
| 2014 | $570 | $50,165 | $12,541 | $37,624 |
Source: Public Records
Map
Nearby Homes
- 3204 Volney St
- 3349 Zamora Way
- 3028 Malisa Way
- 3338 Zamora Way
- 1711 Benedino Cir
- 2427 S Pilgrim St
- 2150 Michael Ave
- 1646 E 8th St
- 1521 Spring St
- 2121 Scribner St
- 2288 E Loomis Rd
- 2318 E Loomis Rd
- 2321 Amboy Ave
- 2328 E Loomis Rd
- 2348 E Loomis Rd
- 2343 Tidewind Dr
- 2041 Superior St
- Plan 2541 at Parkside at Kennedy Ranch
- Plan 2308 Modeled at Parkside at Kennedy Ranch
- Plan 1934 Modeled at Parkside at Kennedy Ranch
- 3359 Phelps St
- 3403 Phelps St
- 3351 Phelps St
- 3411 Phelps St
- 3368 S Airport Way
- 3360 S Airport Way
- 3404 S Airport Way
- 3343 Phelps St
- 3419 Phelps St
- 3352 S Airport Way
- 3412 S Airport Way
- 3344 S Airport Way
- 3420 S Airport Way
- 3335 Phelps St
- 3427 Phelps St
- 3368 Phelps St
- 3360 Phelps St
- 3404 Phelps St
- 3352 Phelps St
- 3412 Phelps St