3368 Lilac Summit Encinitas, CA 92024
Olivenhain NeighborhoodEstimated Value: $4,513,000 - $5,469,000
5
Beds
6
Baths
6,292
Sq Ft
$783/Sq Ft
Est. Value
About This Home
This home is located at 3368 Lilac Summit, Encinitas, CA 92024 and is currently estimated at $4,929,076, approximately $783 per square foot. 3368 Lilac Summit is a home located in San Diego County with nearby schools including Olivenhain Pioneer Elementary, Diegueno Middle School, and La Costa Canyon High School.
Ownership History
Date
Name
Owned For
Owner Type
Purchase Details
Closed on
Sep 21, 2021
Sold by
Hendler Barry S
Bought by
Barry S Hendler Living Trust and Hendler
Current Estimated Value
Purchase Details
Closed on
Jun 2, 2003
Sold by
Lehman Thomas E and Lehman Melissa A
Bought by
Hendler Barry S
Home Financials for this Owner
Home Financials are based on the most recent Mortgage that was taken out on this home.
Original Mortgage
$1,100,000
Interest Rate
4.37%
Mortgage Type
Unknown
Purchase Details
Closed on
Apr 4, 2000
Sold by
Castillero Design & Construction Inc
Bought by
Lehman Thomas E and Lehman Melissa A
Purchase Details
Closed on
Apr 17, 1998
Sold by
Wildflower Estates Associates
Bought by
Castillero Design & Construction Inc
Create a Home Valuation Report for This Property
The Home Valuation Report is an in-depth analysis detailing your home's value as well as a comparison with similar homes in the area
Home Values in the Area
Average Home Value in this Area
Purchase History
| Date | Buyer | Sale Price | Title Company |
|---|---|---|---|
| Barry S Hendler Living Trust | -- | None Listed On Document | |
| Hendler Barry S | $2,050,000 | First American Title Co | |
| Lehman Thomas E | -- | Chicago Title Co | |
| Castillero Design & Construction Inc | $365,000 | Chicago Title Co |
Source: Public Records
Mortgage History
| Date | Status | Borrower | Loan Amount |
|---|---|---|---|
| Previous Owner | Hendler Barry S | $1,100,000 | |
| Closed | Hendler Barry S | $150,000 |
Source: Public Records
Tax History
| Year | Tax Paid | Tax Assessment Tax Assessment Total Assessment is a certain percentage of the fair market value that is determined by local assessors to be the total taxable value of land and additions on the property. | Land | Improvement |
|---|---|---|---|---|
| 2025 | $32,558 | $2,969,074 | $1,448,328 | $1,520,746 |
| 2024 | $32,558 | $2,910,858 | $1,419,930 | $1,490,928 |
| 2023 | $31,856 | $2,853,784 | $1,392,089 | $1,461,695 |
| 2022 | $31,259 | $2,797,829 | $1,364,794 | $1,433,035 |
| 2021 | $30,888 | $2,742,971 | $1,338,034 | $1,404,937 |
| 2020 | $30,522 | $2,714,847 | $1,324,315 | $1,390,532 |
| 2019 | $29,922 | $2,661,616 | $1,298,349 | $1,363,267 |
| 2018 | $29,378 | $2,609,429 | $1,272,892 | $1,336,537 |
| 2017 | $194 | $2,558,265 | $1,247,934 | $1,310,331 |
| 2016 | $27,884 | $2,508,104 | $1,223,465 | $1,284,639 |
| 2015 | $27,468 | $2,470,431 | $1,205,088 | $1,265,343 |
| 2014 | $26,897 | $2,422,039 | $1,181,482 | $1,240,557 |
Source: Public Records
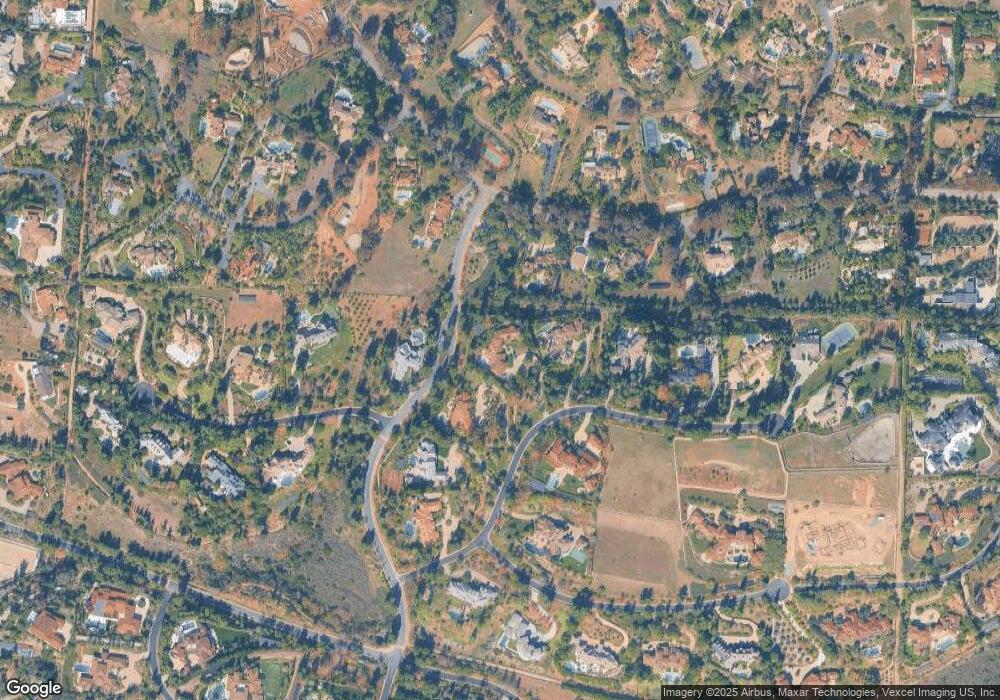
Map
Nearby Homes
- 3303 Lilac Summit
- 3226 Violet Ridge
- 3435 Jasmine Crest Unit A
- 3113 Camino Del Rancho
- 6160 Avenida Del Duque
- 3451 Dove Hollow Rd
- 0 Fortuna Ranch Rd Unit 1
- 3192 Via de Caballo
- 18383 Colina Fuerte
- 18174 Via Ascenso
- 3376 Calle Tres Vistas
- 3401 Adams Run
- 18096 Loma Alegre
- 18102 Via Ascenso
- 18245 Paseo Victoria
- 3368 Calle Margarita
- 0 Lone Hill Ln
- 7992 Paseo Esmerado
- 18441 Calle Tramonto
- 18486 Via Candela
- 3390 Lilac Summit
- 3346 Lilac Summit
- 3233 Wildflower Dr
- 3230 Wildflower Dr Unit A
- 3230 Wildflower Dr
- 3403 Bumann Rd
- 3351 Lilac Summit
- 3412 Lilac Summit
- 3324 Lilac Summit
- 3411 Bumann Rd
- 3361 Bumann Rd
- 3270 Violet Ridge
- 3434 Lilac Summit
- 3302 Lilac Summit
- 3315 Lilac Summit
- 3273 Rim Rock Cir
- 3410 Bumann Rd
- 3402 Bumann Rd
- 3419 Bumann Rd
- 3273 Violet Ridge
Your Personal Tour Guide
Ask me questions while you tour the home.