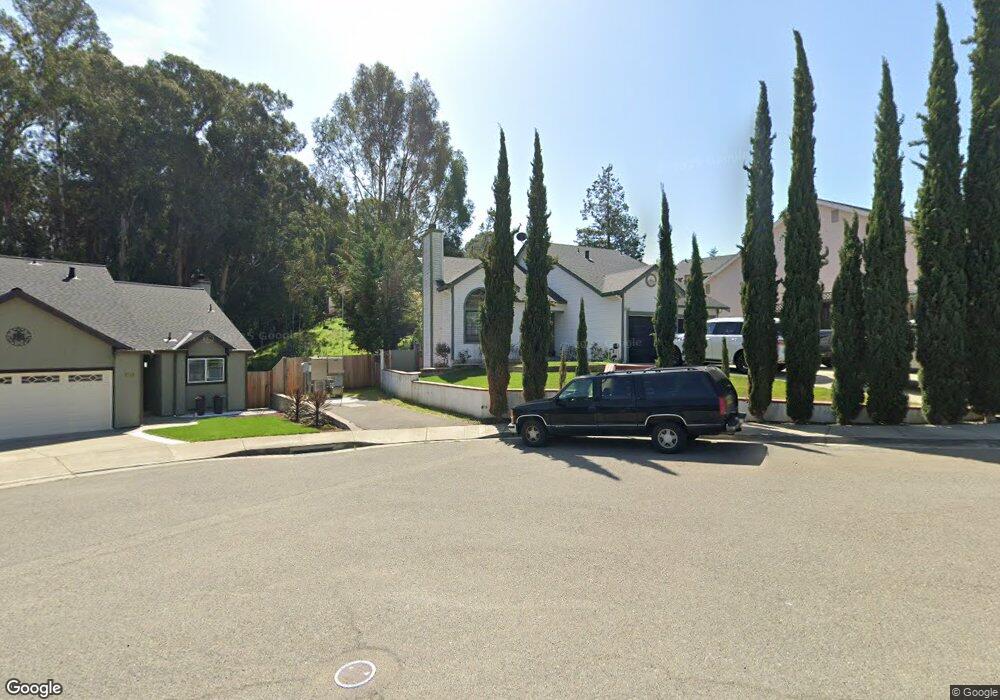
3369 Shawn Way Hayward, CA 94541
Estimated Value: $963,000 - $1,089,000
3
Beds
3
Baths
1,705
Sq Ft
$595/Sq Ft
Est. Value
About This Home
This home is located at 3369 Shawn Way, Hayward, CA 94541 and is currently estimated at $1,013,650, approximately $594 per square foot. 3369 Shawn Way is a home located in Alameda County with nearby schools including Fairview Elementary School, Bret Harte Middle School, and Hayward High School.
Ownership History
Date
Name
Owned For
Owner Type
Purchase Details
Closed on
Jun 26, 2002
Sold by
Delrio Jorge and Delrio Maria Dejesus
Bought by
Burgos Ana
Current Estimated Value
Home Financials for this Owner
Home Financials are based on the most recent Mortgage that was taken out on this home.
Original Mortgage
$100,000
Outstanding Balance
$42,332
Interest Rate
6.69%
Estimated Equity
$971,318
Purchase Details
Closed on
Aug 2, 1996
Sold by
Murga Luis E and Murga Monica
Bought by
Delrio Jorge and Delrio Maria Dejesus
Purchase Details
Closed on
Oct 18, 1994
Sold by
California S & L
Bought by
Murga Luis E and Murga Monica
Home Financials for this Owner
Home Financials are based on the most recent Mortgage that was taken out on this home.
Original Mortgage
$189,000
Interest Rate
8.7%
Purchase Details
Closed on
Jul 20, 1994
Sold by
Northern Auxiliary Corp
Bought by
California S & L
Create a Home Valuation Report for This Property
The Home Valuation Report is an in-depth analysis detailing your home's value as well as a comparison with similar homes in the area
Home Values in the Area
Average Home Value in this Area
Purchase History
| Date | Buyer | Sale Price | Title Company |
|---|---|---|---|
| Burgos Ana | -- | Old Republic Title Company | |
| Delrio Jorge | -- | Old Republic Title Company | |
| Burgos Ana | -- | Old Republic Title Company | |
| Murga Luis E | $210,000 | Old Republic Title Company | |
| California S & L | $201,650 | North American Title Co Inc |
Source: Public Records
Mortgage History
| Date | Status | Borrower | Loan Amount |
|---|---|---|---|
| Open | Burgos Ana | $100,000 | |
| Previous Owner | Murga Luis E | $189,000 |
Source: Public Records
Tax History Compared to Growth
Tax History
| Year | Tax Paid | Tax Assessment Tax Assessment Total Assessment is a certain percentage of the fair market value that is determined by local assessors to be the total taxable value of land and additions on the property. | Land | Improvement |
|---|---|---|---|---|
| 2025 | $6,438 | $484,983 | $147,594 | $344,389 |
| 2024 | $6,438 | $475,338 | $144,701 | $337,637 |
| 2023 | $6,372 | $472,884 | $141,865 | $331,019 |
| 2022 | $6,224 | $456,613 | $139,083 | $324,530 |
| 2021 | $6,146 | $447,525 | $136,357 | $318,168 |
| 2020 | $6,048 | $449,868 | $134,960 | $314,908 |
| 2019 | $6,071 | $441,049 | $132,314 | $308,735 |
| 2018 | $5,701 | $432,402 | $129,720 | $302,682 |
| 2017 | $5,558 | $423,926 | $127,177 | $296,749 |
| 2016 | $5,238 | $415,618 | $124,685 | $290,933 |
| 2015 | $5,124 | $409,376 | $122,812 | $286,564 |
| 2014 | $4,874 | $401,359 | $120,407 | $280,952 |
Source: Public Records
Map
Nearby Homes
- 3260 Jamie Way
- 3287 Kelly St
- 23380 Lakeridge Ave
- 24392 Machado Ct
- 23049 Lakeridge Ave
- 22633 Mossy Rock Dr
- 22679 Valley View Dr
- 22561 Mossy Rock Dr
- 3606 Sarita St
- 2936 Pickford Way
- 25657 Crestfield Dr
- 23066 Maud Ave
- 2980 D St
- 3285 Monika Ln
- 3241 Monika Ln
- 3109 Vista Ln
- 3264 Monika Ln
- 3238 Monika Ln
- 23920 Mayville Dr
- 23730 Stratton Ct