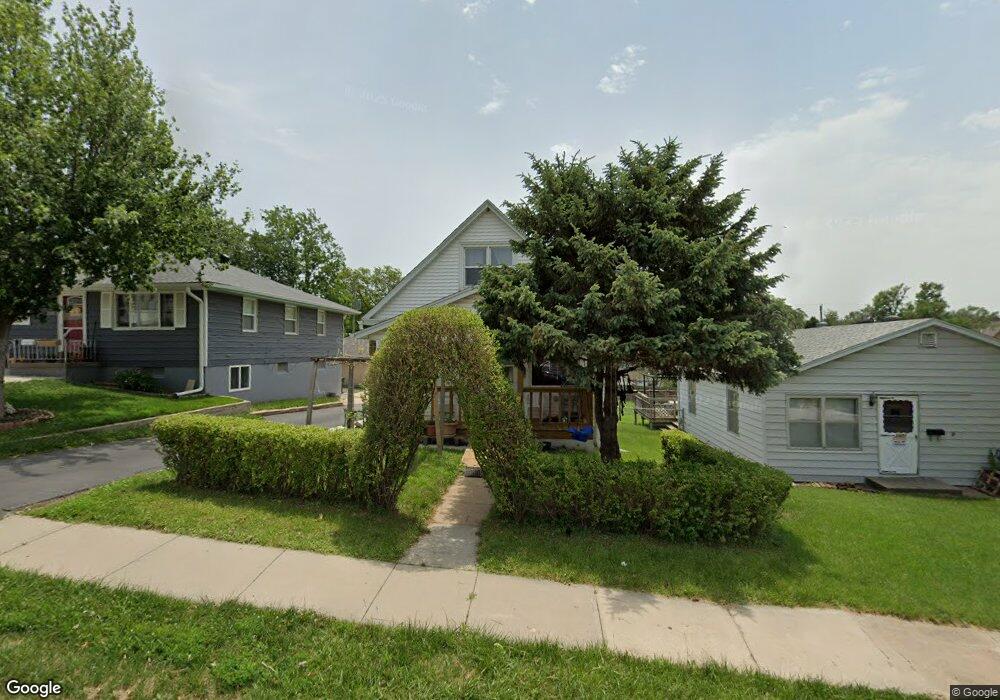
3369 T St Omaha, NE 68107
South Central Omaha NeighborhoodEstimated Value: $160,000 - $204,989
4
Beds
3
Baths
1,163
Sq Ft
$159/Sq Ft
Est. Value
About This Home
This home is located at 3369 T St, Omaha, NE 68107 and is currently estimated at $184,747, approximately $158 per square foot. 3369 T St is a home located in Douglas County with nearby schools including Indian Hill Elementary School, Sts. Peter and Paul School, and Assumption-Guadalupe School.
Ownership History
Date
Name
Owned For
Owner Type
Purchase Details
Closed on
May 24, 2006
Sold by
Klimantas John S
Bought by
Perez Pedro
Current Estimated Value
Purchase Details
Closed on
Nov 20, 2002
Sold by
Kudirka Valentinas and Kudirka Ona
Bought by
Klimantas John S
Home Financials for this Owner
Home Financials are based on the most recent Mortgage that was taken out on this home.
Original Mortgage
$57,000
Interest Rate
6.13%
Create a Home Valuation Report for This Property
The Home Valuation Report is an in-depth analysis detailing your home's value as well as a comparison with similar homes in the area
Home Values in the Area
Average Home Value in this Area
Purchase History
| Date | Buyer | Sale Price | Title Company |
|---|---|---|---|
| Perez Pedro | $85,000 | -- | |
| Klimantas John S | $60,000 | -- |
Source: Public Records
Mortgage History
| Date | Status | Borrower | Loan Amount |
|---|---|---|---|
| Previous Owner | Klimantas John S | $57,000 |
Source: Public Records
Tax History
| Year | Tax Paid | Tax Assessment Tax Assessment Total Assessment is a certain percentage of the fair market value that is determined by local assessors to be the total taxable value of land and additions on the property. | Land | Improvement |
|---|---|---|---|---|
| 2025 | $2,159 | $175,100 | $9,700 | $165,400 |
| 2024 | $2,817 | $133,500 | $9,700 | $123,800 |
| 2023 | $2,817 | $133,500 | $9,700 | $123,800 |
| 2022 | $2,570 | $120,400 | $6,300 | $114,100 |
| 2021 | $2,085 | $98,500 | $6,300 | $92,200 |
| 2020 | $2,145 | $100,200 | $6,300 | $93,900 |
| 2019 | $1,694 | $78,900 | $6,300 | $72,600 |
| 2018 | $1,851 | $86,100 | $6,300 | $79,800 |
| 2017 | $1,433 | $66,300 | $4,500 | $61,800 |
| 2016 | $1,423 | $66,300 | $4,500 | $61,800 |
Source: Public Records
Map
Nearby Homes
Your Personal Tour Guide
Ask me questions while you tour the home.