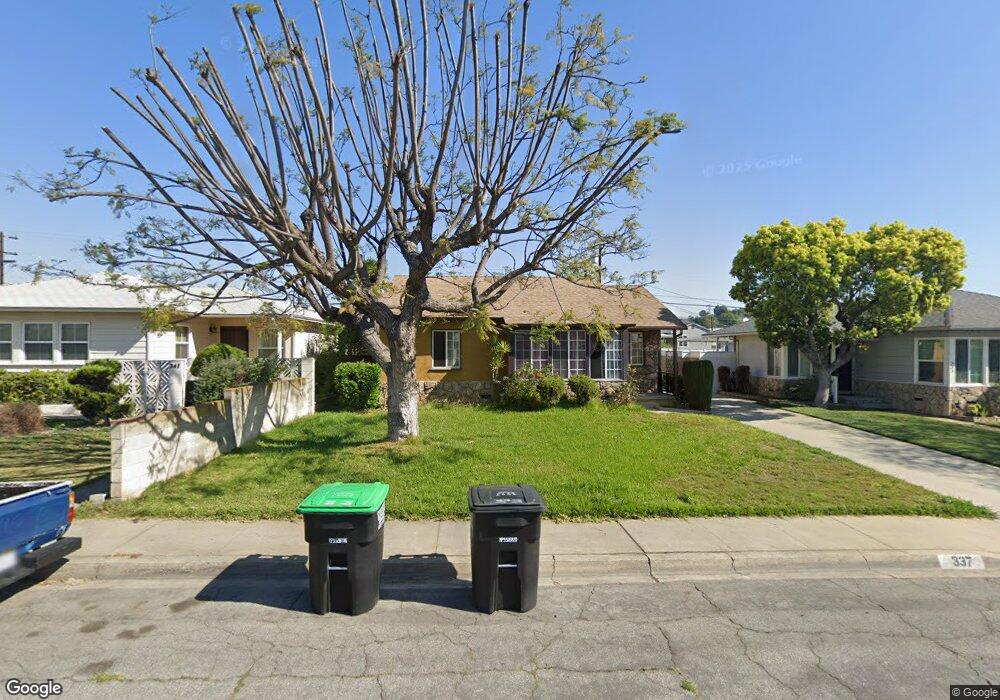
337 Almora St Monterey Park, CA 91754
Estimated Value: $798,758 - $904,000
3
Beds
2
Baths
1,114
Sq Ft
$751/Sq Ft
Est. Value
About This Home
This home is located at 337 Almora St, Monterey Park, CA 91754 and is currently estimated at $836,690, approximately $751 per square foot. 337 Almora St is a home located in Los Angeles County with nearby schools including Bella Vista Elementary School, Macy Intermediate School, and Schurr High School.
Ownership History
Date
Name
Owned For
Owner Type
Purchase Details
Closed on
Dec 27, 2002
Sold by
Avitia Mike A and Avitia Hilda C
Bought by
Avitia Mike A
Current Estimated Value
Home Financials for this Owner
Home Financials are based on the most recent Mortgage that was taken out on this home.
Original Mortgage
$124,280
Interest Rate
6.15%
Purchase Details
Closed on
Sep 10, 1996
Sold by
Avitia Miguel A and Avitia Hilda C
Bought by
Avitia Mike A
Purchase Details
Closed on
Mar 25, 1996
Sold by
Avitia Miguel A
Bought by
Avitia Miguel A and Avitia Hilda C
Home Financials for this Owner
Home Financials are based on the most recent Mortgage that was taken out on this home.
Original Mortgage
$127,500
Interest Rate
6.98%
Create a Home Valuation Report for This Property
The Home Valuation Report is an in-depth analysis detailing your home's value as well as a comparison with similar homes in the area
Home Values in the Area
Average Home Value in this Area
Purchase History
| Date | Buyer | Sale Price | Title Company |
|---|---|---|---|
| Avitia Mike A | -- | Fidelity National Title Co | |
| Avitia Mike A | -- | -- | |
| Avitia Miguel A | -- | Continental Lawyers Title Co |
Source: Public Records
Mortgage History
| Date | Status | Borrower | Loan Amount |
|---|---|---|---|
| Closed | Avitia Mike A | $124,280 | |
| Previous Owner | Avitia Miguel A | $127,500 |
Source: Public Records
Tax History Compared to Growth
Tax History
| Year | Tax Paid | Tax Assessment Tax Assessment Total Assessment is a certain percentage of the fair market value that is determined by local assessors to be the total taxable value of land and additions on the property. | Land | Improvement |
|---|---|---|---|---|
| 2025 | $1,408 | $79,255 | $33,549 | $45,706 |
| 2024 | $1,408 | $77,702 | $32,892 | $44,810 |
| 2023 | $1,405 | $76,180 | $32,248 | $43,932 |
| 2022 | $1,363 | $74,687 | $31,616 | $43,071 |
| 2021 | $1,318 | $73,224 | $30,997 | $42,227 |
| 2019 | $1,275 | $71,055 | $30,079 | $40,976 |
| 2018 | $1,230 | $69,663 | $29,490 | $40,173 |
| 2016 | $1,189 | $66,960 | $28,346 | $38,614 |
| 2015 | $1,127 | $65,955 | $27,921 | $38,034 |
| 2014 | $1,121 | $61,350 | $27,375 | $33,975 |
Source: Public Records
Map
Nearby Homes
- 501 W Floral Dr
- 413 W Riggin St
- 498 W Riggin St
- 1701 S Mcpherrin Ave
- 1800 Fernbank Ave
- 500 A S Garfield Unit A
- 2012 S Garfield Ave
- 105 E Floral Dr
- 109 E Hammel St
- 1351 S Ynez Ave
- 532 W Gleason St
- 1240 S Ynez Ave
- 1301 S Atlantic Blvd Unit 234C
- 150 E Floral Dr
- 1100 S Grandridge Ave
- 1804 Wilcox Ave
- 833 Findlay Ave
- 1027 De la Fuente St
- 269 E Markland Dr
- 3613 Via Campo