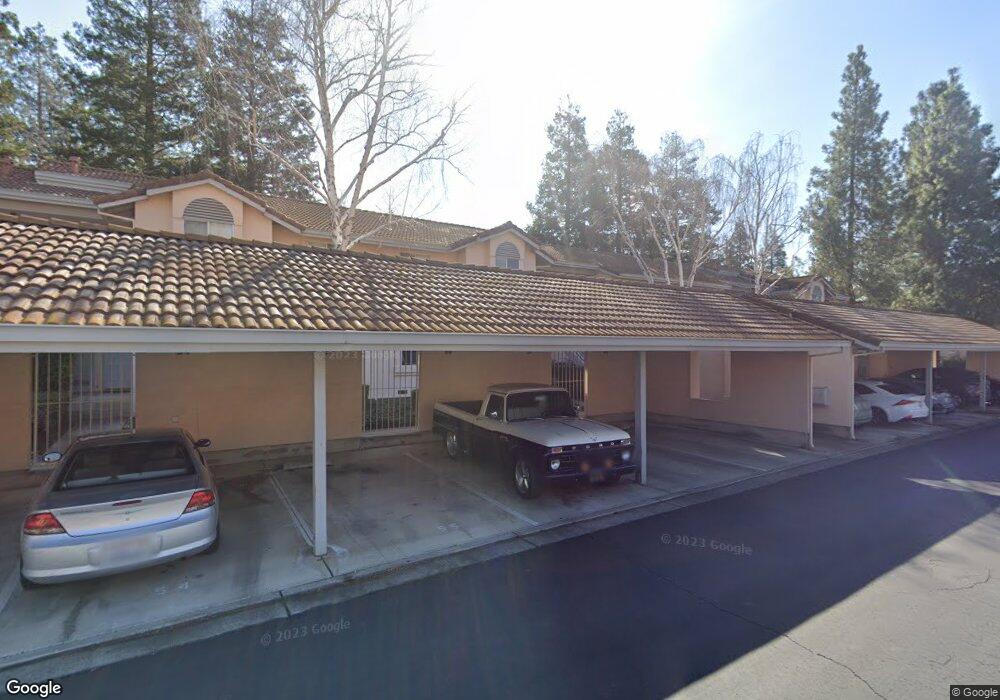
337 Chris Common Unit 107 Livermore, CA 94550
Windmill Springs NeighborhoodEstimated Value: $388,871 - $489,000
1
Bed
1
Bath
610
Sq Ft
$712/Sq Ft
Est. Value
About This Home
This home is located at 337 Chris Common Unit 107, Livermore, CA 94550 and is currently estimated at $434,218, approximately $711 per square foot. 337 Chris Common Unit 107 is a home located in Alameda County with nearby schools including Arroyo Seco Elementary School, East Avenue Middle School, and Livermore High School.
Ownership History
Date
Name
Owned For
Owner Type
Purchase Details
Closed on
Jun 16, 2020
Sold by
Hwang Stephen and Hwang Katherine L
Bought by
Hwang Stephen and Hwang Katherine L
Current Estimated Value
Purchase Details
Closed on
Mar 13, 2020
Sold by
Tamura Makio
Bought by
Hwang Stephen and Hwang Katherine L
Home Financials for this Owner
Home Financials are based on the most recent Mortgage that was taken out on this home.
Original Mortgage
$168,500
Outstanding Balance
$116,407
Interest Rate
3.4%
Mortgage Type
New Conventional
Estimated Equity
$317,811
Purchase Details
Closed on
Feb 14, 2014
Sold by
Fujiki Mayo
Bought by
Tamura Makio
Home Financials for this Owner
Home Financials are based on the most recent Mortgage that was taken out on this home.
Original Mortgage
$204,300
Interest Rate
4.38%
Mortgage Type
New Conventional
Purchase Details
Closed on
Feb 12, 2014
Sold by
Tamura Makio
Bought by
Tamura Makio
Home Financials for this Owner
Home Financials are based on the most recent Mortgage that was taken out on this home.
Original Mortgage
$204,300
Interest Rate
4.38%
Mortgage Type
New Conventional
Purchase Details
Closed on
Jul 12, 2007
Sold by
Oyadomari Diane
Bought by
Tamura Mako
Purchase Details
Closed on
Jul 26, 2004
Sold by
Carlton Shalimar
Bought by
Oyadomari Diane
Home Financials for this Owner
Home Financials are based on the most recent Mortgage that was taken out on this home.
Original Mortgage
$192,000
Interest Rate
1.25%
Mortgage Type
Negative Amortization
Purchase Details
Closed on
Jul 23, 2004
Sold by
Carlton Patrick
Bought by
Carlton Shalimar and Wakeland Shalimar
Home Financials for this Owner
Home Financials are based on the most recent Mortgage that was taken out on this home.
Original Mortgage
$192,000
Interest Rate
1.25%
Mortgage Type
Negative Amortization
Purchase Details
Closed on
Sep 29, 1999
Sold by
Anderson Jason
Bought by
Wakeland Shalimar
Home Financials for this Owner
Home Financials are based on the most recent Mortgage that was taken out on this home.
Original Mortgage
$99,840
Interest Rate
8.6%
Mortgage Type
Purchase Money Mortgage
Purchase Details
Closed on
Nov 23, 1998
Sold by
Bettencourt Toni J
Bought by
Anderson Jason
Home Financials for this Owner
Home Financials are based on the most recent Mortgage that was taken out on this home.
Original Mortgage
$86,900
Interest Rate
6.69%
Mortgage Type
Purchase Money Mortgage
Create a Home Valuation Report for This Property
The Home Valuation Report is an in-depth analysis detailing your home's value as well as a comparison with similar homes in the area
Home Values in the Area
Average Home Value in this Area
Purchase History
| Date | Buyer | Sale Price | Title Company |
|---|---|---|---|
| Hwang Stephen | -- | None Available | |
| Hwang Stephen | $358,500 | Chicago Title Company | |
| Tamura Makio | -- | Title365 | |
| Tamura Makio | -- | Title365 | |
| Tamura Mako | $270,000 | Chicago Title Co | |
| Oyadomari Diane | $240,000 | Chicago Title Company | |
| Carlton Shalimar | -- | Chicago Title Company | |
| Wakeland Shalimar | $125,000 | Old Republic Title Co | |
| Anderson Jason | $91,500 | Old Republic Title Company |
Source: Public Records
Mortgage History
| Date | Status | Borrower | Loan Amount |
|---|---|---|---|
| Open | Hwang Stephen | $168,500 | |
| Previous Owner | Tamura Makio | $204,300 | |
| Previous Owner | Tamura Makio | $204,300 | |
| Previous Owner | Oyadomari Diane | $192,000 | |
| Previous Owner | Wakeland Shalimar | $99,840 | |
| Previous Owner | Anderson Jason | $86,900 | |
| Closed | Wakeland Shalimar | $24,960 | |
| Closed | Oyadomari Diane | $24,000 |
Source: Public Records
Tax History
| Year | Tax Paid | Tax Assessment Tax Assessment Total Assessment is a certain percentage of the fair market value that is determined by local assessors to be the total taxable value of land and additions on the property. | Land | Improvement |
|---|---|---|---|---|
| 2025 | $5,350 | $392,065 | $98,426 | $293,639 |
| 2024 | $5,350 | $384,380 | $96,497 | $287,883 |
| 2023 | $5,265 | $376,844 | $94,605 | $282,239 |
| 2022 | $5,183 | $369,455 | $92,750 | $276,705 |
| 2021 | $5,075 | $362,213 | $90,932 | $271,281 |
| 2020 | $4,512 | $324,267 | $97,280 | $226,987 |
| 2019 | $4,503 | $317,911 | $95,373 | $222,538 |
| 2018 | $4,403 | $311,678 | $93,503 | $218,175 |
| 2017 | $4,048 | $285,000 | $85,500 | $199,500 |
| 2016 | $3,590 | $260,000 | $78,000 | $182,000 |
| 2015 | $3,220 | $240,000 | $72,000 | $168,000 |
| 2014 | $2,347 | $160,000 | $48,000 | $112,000 |
Source: Public Records
Map
Nearby Homes
- 337 Chris Common Unit 111
- 4671 Laurie Common Unit 105
- 4671 Laurie Common Unit 103
- 4844 Mulqueeney Common
- 732 Hazel St
- 4715 Marengo Common
- 4711 Marengo Common
- 838 Hazel St
- 4707 Marengo Common
- 4723 Marengo Common
- 5221 Lenore Ave
- 317 Hillcrest Ave
- 3992 Yale Way
- 3959 Purdue Way
- 4115 Freeda Ct
- 5218 Norma Way
- 1368 Pegan Common
- 973 Jessica Dr
- 4669 Almond Cir
- 3873 Inverness Common
- 337 Chris Common
- 337 Chris Common Unit 2
- 337 Chris Common Unit 112
- 337 Chris Common Unit 110
- 337 Chris Common Unit 109
- 337 Chris Common Unit 108
- 337 Chris Common Unit 106
- 337 Chris Common Unit 105
- 337 Chris Common Unit 104
- 337 Chris Common Unit 103
- 337 Chris Common Unit 102
- 337 Chris Common Unit 101
- 330 Leslie Common Unit 112
- 330 Leslie Common Unit 110
- 330 Leslie Common Unit 109
- 330 Leslie Common Unit 108
- 330 Leslie Common Unit 107
- 330 Leslie Common Unit 106
- 330 Leslie Common Unit 105
- 330 Leslie Common Unit 104
Your Personal Tour Guide
Ask me questions while you tour the home.