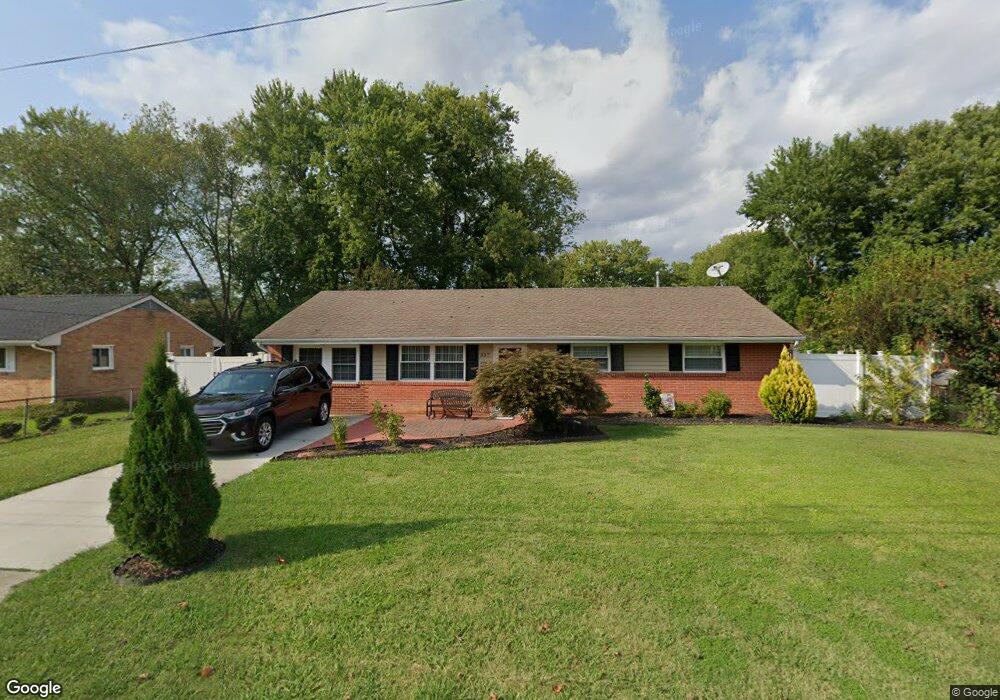
337 Curtis Tignor Rd Newport News, VA 23608
Epes NeighborhoodEstimated Value: $255,000 - $329,000
4
Beds
2
Baths
1,323
Sq Ft
$220/Sq Ft
Est. Value
About This Home
This home is located at 337 Curtis Tignor Rd, Newport News, VA 23608 and is currently estimated at $290,699, approximately $219 per square foot. 337 Curtis Tignor Rd is a home located in Newport News City with nearby schools including Stoney Run Elementary School, Mary Passage Middle School, and Denbigh High School.
Ownership History
Date
Name
Owned For
Owner Type
Purchase Details
Closed on
Jun 14, 2018
Sold by
Rebuilding America Properties Llc A Virg
Bought by
Rose Betty Z
Current Estimated Value
Home Financials for this Owner
Home Financials are based on the most recent Mortgage that was taken out on this home.
Original Mortgage
$147,000
Outstanding Balance
$127,130
Interest Rate
4.5%
Mortgage Type
New Conventional
Estimated Equity
$163,569
Purchase Details
Closed on
Sep 27, 2017
Sold by
Prolific Properties Llc A Virginia Limit
Bought by
Rebuilding America Properties Llc A Virg
Purchase Details
Closed on
May 23, 2017
Sold by
Terra Abstract Virginia Inc
Bought by
Lakeview Loan Servicing Llc
Purchase Details
Closed on
Apr 15, 2009
Sold by
Sims Shirley M
Bought by
Gross Gregory T
Home Financials for this Owner
Home Financials are based on the most recent Mortgage that was taken out on this home.
Original Mortgage
$157,003
Interest Rate
4.86%
Mortgage Type
FHA
Create a Home Valuation Report for This Property
The Home Valuation Report is an in-depth analysis detailing your home's value as well as a comparison with similar homes in the area
Home Values in the Area
Average Home Value in this Area
Purchase History
| Date | Buyer | Sale Price | Title Company |
|---|---|---|---|
| Rose Betty Z | $189,900 | Equity Title Company | |
| Rebuilding America Properties Llc A Virg | $90,000 | Attorney | |
| Lakeview Loan Servicing Llc | $85,860 | None Available | |
| Gross Gregory T | $159,900 | -- |
Source: Public Records
Mortgage History
| Date | Status | Borrower | Loan Amount |
|---|---|---|---|
| Open | Rose Betty Z | $147,000 | |
| Previous Owner | Gross Gregory T | $157,003 |
Source: Public Records
Tax History Compared to Growth
Tax History
| Year | Tax Paid | Tax Assessment Tax Assessment Total Assessment is a certain percentage of the fair market value that is determined by local assessors to be the total taxable value of land and additions on the property. | Land | Improvement |
|---|---|---|---|---|
| 2024 | $2,902 | $245,900 | $60,500 | $185,400 |
| 2023 | $2,887 | $232,200 | $60,500 | $171,700 |
| 2022 | $2,719 | $214,300 | $60,500 | $153,800 |
| 2021 | $2,463 | $189,800 | $55,000 | $134,800 |
| 2020 | $2,271 | $174,100 | $55,000 | $119,100 |
| 2019 | $2,210 | $169,500 | $55,000 | $114,500 |
| 2018 | $2,102 | $160,900 | $55,000 | $105,900 |
| 2017 | $1,772 | $133,800 | $55,000 | $78,800 |
| 2016 | $1,731 | $130,800 | $55,000 | $75,800 |
| 2015 | $1,725 | $130,800 | $55,000 | $75,800 |
| 2014 | $1,583 | $130,800 | $55,000 | $75,800 |
Source: Public Records
Map
Nearby Homes
- 328 Thalia Dr
- 323 Kingsman Dr
- 219 Saddler Dr
- 885 Clemson Dr
- 937 Sherry Cir
- 881 Clemson Dr
- 203 Cherokee Ct
- 238 Susan Constant Dr
- 359 Georgetown Loop
- 944 Colleen Dr
- 358 Susan Constant Dr
- 353 Susan Constant Dr
- 305 Ilene Dr
- 212 Beechmont Dr
- 904 Loraine Cir
- 854 Eads Ct
- 32 Garfield Dr
- 179 Stony Ridge Ct
- 882 Catalina Dr
- 120 Vista Dr
- 335 Curtis Tignor Rd
- 339 Curtis Tignor Rd
- 330 Thalia Dr
- 332 Thalia Dr
- 341 Curtis Tignor Rd
- 334 Thalia Dr
- 336 Curtis Tignor Rd
- 338 Curtis Tignor Rd
- 334 Curtis Tignor Rd
- 340 Curtis Tignor Rd
- 331 Curtis Tignor Rd
- 336 Thalia Dr
- 324 Thalia Dr
- 343 Curtis Tignor Rd
- 916 Sumter Dr
- 342 Curtis Tignor Rd
- 338 Thalia Dr
- 322 Thalia Dr
- 329 Curtis Tignor Rd
- 337 Helena Dr