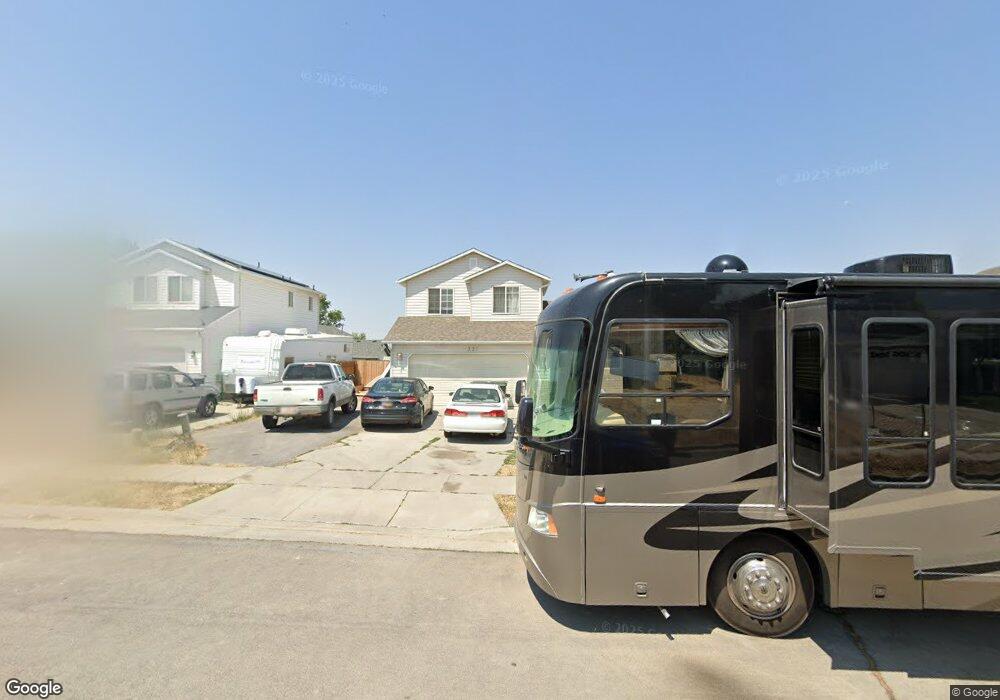
337 E 880 N Tooele, UT 84074
Estimated Value: $409,512 - $430,000
4
Beds
3
Baths
2,017
Sq Ft
$207/Sq Ft
Est. Value
About This Home
This home is located at 337 E 880 N, Tooele, UT 84074 and is currently estimated at $417,128, approximately $206 per square foot. 337 E 880 N is a home located in Tooele County with nearby schools including Copper Canyon Elementary School, Clarke N. Johnsen Junior High School, and Stansbury High School.
Ownership History
Date
Name
Owned For
Owner Type
Purchase Details
Closed on
Dec 13, 2010
Sold by
Larsen Gregory D
Bought by
Stone Rian C and Stone Amy T
Current Estimated Value
Home Financials for this Owner
Home Financials are based on the most recent Mortgage that was taken out on this home.
Original Mortgage
$155,400
Outstanding Balance
$102,461
Interest Rate
4.18%
Mortgage Type
New Conventional
Estimated Equity
$314,667
Purchase Details
Closed on
Sep 20, 2010
Sold by
Garvin John and Garvin Julie
Bought by
Larsen Gregory D
Purchase Details
Closed on
Nov 19, 2009
Sold by
Chaudhry Sajid Sultan and Brown-Chaudhry Deborah R
Bought by
Garvin John
Purchase Details
Closed on
Aug 4, 2006
Sold by
Garvin John
Bought by
Chaudhry Deborah Brown and Chaudhry Sajid Sultan
Purchase Details
Closed on
Feb 13, 2006
Sold by
Garvin John and Garvin Julie
Bought by
Garvin John
Create a Home Valuation Report for This Property
The Home Valuation Report is an in-depth analysis detailing your home's value as well as a comparison with similar homes in the area
Purchase History
| Date | Buyer | Sale Price | Title Company |
|---|---|---|---|
| Stone Rian C | -- | Tooele Title Co | |
| Larsen Gregory D | -- | Etitle Insurance Agency | |
| Garvin John | -- | None Available | |
| Chaudhry Deborah Brown | -- | Backman Title Services | |
| Garvin John | -- | Accommodation |
Source: Public Records
Mortgage History
| Date | Status | Borrower | Loan Amount |
|---|---|---|---|
| Open | Stone Rian C | $155,400 |
Source: Public Records
Tax History
| Year | Tax Paid | Tax Assessment Tax Assessment Total Assessment is a certain percentage of the fair market value that is determined by local assessors to be the total taxable value of land and additions on the property. | Land | Improvement |
|---|---|---|---|---|
| 2025 | $2,583 | $391,667 | $100,000 | $291,667 |
| 2024 | $2,739 | $209,102 | $55,000 | $154,102 |
| 2023 | $2,739 | $214,710 | $52,383 | $162,327 |
| 2022 | $2,487 | $214,014 | $51,906 | $162,108 |
| 2021 | $2,021 | $145,461 | $20,763 | $124,698 |
| 2020 | $1,939 | $242,006 | $37,750 | $204,256 |
| 2019 | $1,820 | $223,437 | $37,750 | $185,687 |
| 2018 | $1,695 | $197,362 | $40,000 | $157,362 |
| 2017 | $1,138 | $157,282 | $35,000 | $122,282 |
| 2016 | $954 | $77,733 | $19,250 | $58,483 |
| 2015 | $954 | $69,416 | $0 | $0 |
| 2014 | -- | $69,416 | $0 | $0 |
Source: Public Records
Map
Nearby Homes
Your Personal Tour Guide
Ask me questions while you tour the home.