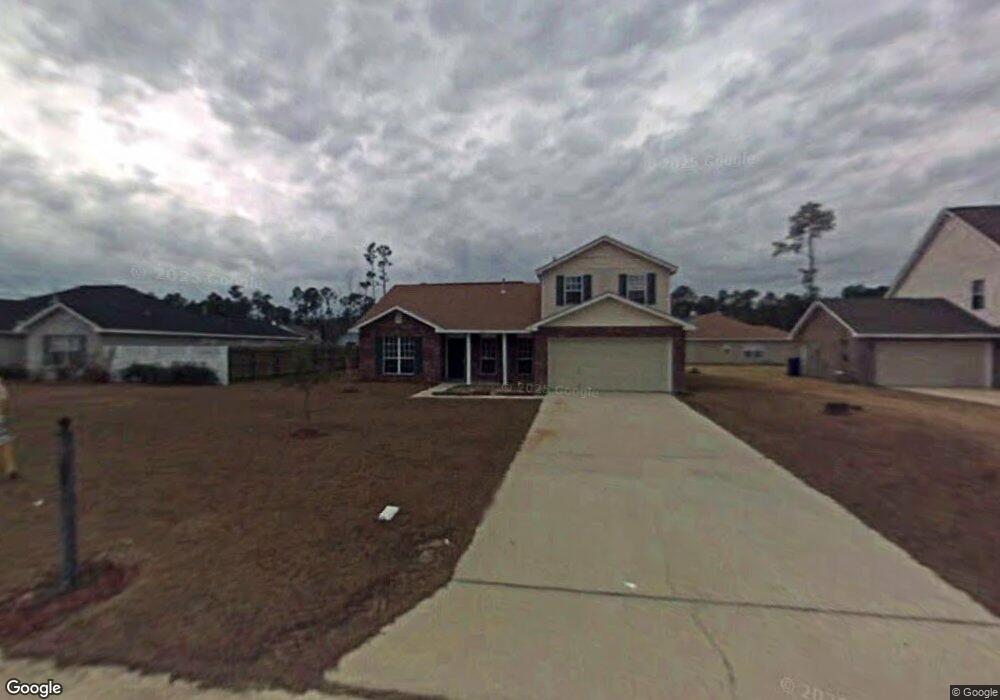
337 E Silvermaple Dr Slidell, LA 70458
Estimated Value: $295,170 - $332,000
4
Beds
3
Baths
2,258
Sq Ft
$140/Sq Ft
Est. Value
About This Home
This home is located at 337 E Silvermaple Dr, Slidell, LA 70458 and is currently estimated at $315,043, approximately $139 per square foot. 337 E Silvermaple Dr is a home located in St. Tammany Parish with nearby schools including Whispering Forest Elementary School, Clearwood Junior High School, and Northshore High School.
Ownership History
Date
Name
Owned For
Owner Type
Purchase Details
Closed on
Apr 24, 2015
Sold by
Landreneau Meredith P and Landreneau Darren P
Bought by
Branchcomb Christina H and Branchcomb Keith E
Current Estimated Value
Purchase Details
Closed on
Dec 3, 2010
Sold by
Mccracking Alicia Cambre and Mccracking Roger S
Bought by
Landreneau Meredith Paul and Landreneau Darren P
Home Financials for this Owner
Home Financials are based on the most recent Mortgage that was taken out on this home.
Original Mortgage
$188,006
Interest Rate
4.23%
Mortgage Type
VA
Purchase Details
Closed on
Apr 7, 2008
Sold by
Acosta Bernard Raymond and Acosta Rose Castjohn
Bought by
Mccracking Roger S and Mccracking Alicia Cambre
Home Financials for this Owner
Home Financials are based on the most recent Mortgage that was taken out on this home.
Original Mortgage
$198,879
Interest Rate
6%
Mortgage Type
FHA
Create a Home Valuation Report for This Property
The Home Valuation Report is an in-depth analysis detailing your home's value as well as a comparison with similar homes in the area
Home Values in the Area
Average Home Value in this Area
Purchase History
| Date | Buyer | Sale Price | Title Company |
|---|---|---|---|
| Branchcomb Christina H | $220,000 | First American Title | |
| Landreneau Meredith Paul | $182,000 | Mahony Title & Land Services | |
| Mccracking Roger S | $202,000 | United Title Of Louisiana In |
Source: Public Records
Mortgage History
| Date | Status | Borrower | Loan Amount |
|---|---|---|---|
| Previous Owner | Landreneau Meredith Paul | $188,006 | |
| Previous Owner | Mccracking Roger S | $198,879 |
Source: Public Records
Tax History
| Year | Tax Paid | Tax Assessment Tax Assessment Total Assessment is a certain percentage of the fair market value that is determined by local assessors to be the total taxable value of land and additions on the property. | Land | Improvement |
|---|---|---|---|---|
| 2025 | $2,139 | $25,526 | $3,214 | $22,312 |
| 2024 | $2,139 | $25,526 | $3,214 | $22,312 |
| 2023 | $2,547 | $23,230 | $3,214 | $20,016 |
| 2022 | $241,952 | $23,230 | $3,214 | $20,016 |
| 2021 | $2,416 | $23,230 | $3,214 | $20,016 |
| 2020 | $1,616 | $17,631 | $3,000 | $14,631 |
| 2019 | $3,486 | $22,553 | $3,120 | $19,433 |
| 2018 | $3,498 | $22,553 | $3,120 | $19,433 |
| 2017 | $3,581 | $22,553 | $3,120 | $19,433 |
| 2016 | $3,510 | $22,553 | $3,120 | $19,433 |
| 2015 | $1,667 | $16,933 | $1,800 | $15,133 |
| 2014 | $1,638 | $16,933 | $1,800 | $15,133 |
| 2013 | -- | $16,933 | $1,800 | $15,133 |
Source: Public Records
Map
Nearby Homes
- 688 Fairfield Loop
- 135 Ashton Parc
- 135 Ashton Parc None
- 629 Claiborne Trails Dr
- 0 U S Hwy 11 Hwy
- 420 E Redbud Dr
- 633 High Ridge Loop
- 600 Claiborne Trails Dr
- 0 Haas Rd Unit 2540360
- LOTS 5-7 & 12 N 9th St
- 000 N 1st Ave
- 109 Meredith Dr
- 102 Eddie Dr
- 208 N Queens Dr
- 52620 Highway 90
- 215 E Queens Dr
- 111 Dixie Cir
- 204 E Queens Dr
- 337 E Silver Maple Dr
- 333 E Silvermaple Dr
- 333 E Silver Maple Dr
- 341 E Silver Maple Dr
- 216 N Silver Maple Dr
- 329 E Silver Maple Dr
- 329 E Silvermaple Dr
- 1009 Chestnut Ct
- 340 E Silvermaple Dr
- 336 E Silver Maple Dr
- 1012 Chestnut Ct
- 328 E Silvermaple Dr
- 328 E Silver Maple Dr
- 212 N Silver Maple Dr
- 325 E Silver Maple Dr
- 325 E Silvermaple Dr
- 344 E Silvermaple Dr
- 221 N Silver Maple Dr
- 344 E Silver Maple Dr
- 324 E Silver Maple Dr
Your Personal Tour Guide
Ask me questions while you tour the home.