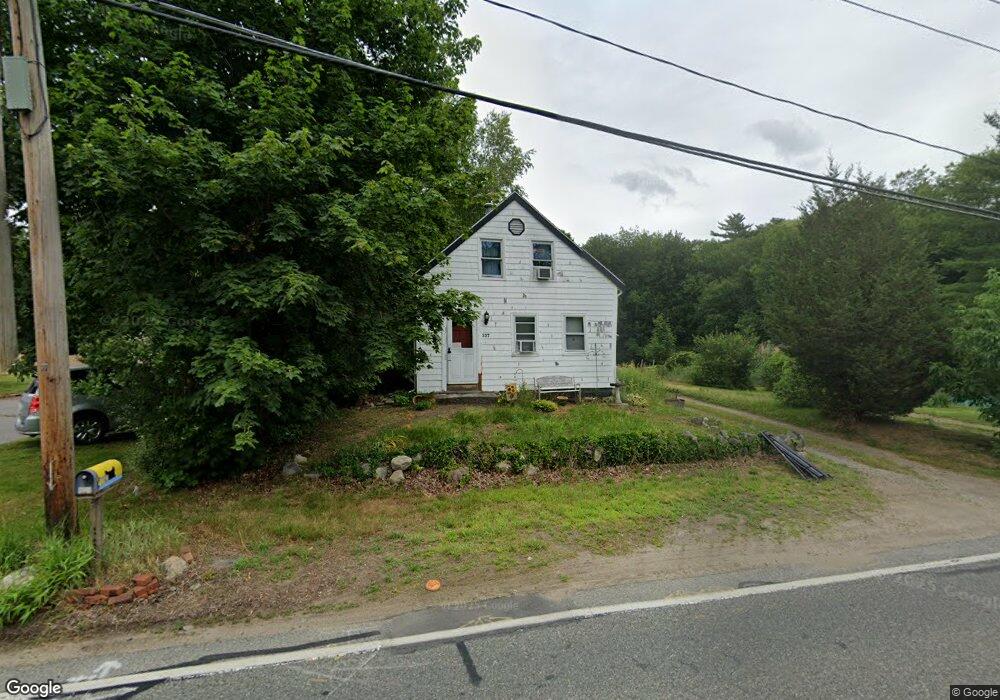
337 Elm St East Bridgewater, MA 02333
Estimated Value: $473,577 - $537,000
3
Beds
1
Bath
1,457
Sq Ft
$355/Sq Ft
Est. Value
About This Home
This home is located at 337 Elm St, East Bridgewater, MA 02333 and is currently estimated at $517,394, approximately $355 per square foot. 337 Elm St is a home located in Plymouth County with nearby schools including Central Elementary School, Gordon W Mitchell Middle School, and East Bridgewater Jr./Sr. High School.
Ownership History
Date
Name
Owned For
Owner Type
Purchase Details
Closed on
Dec 1, 1997
Sold by
Est Swift Joann P and Swift Christopher A
Bought by
Markowicz Michael W and Markowicz Paula C
Current Estimated Value
Home Financials for this Owner
Home Financials are based on the most recent Mortgage that was taken out on this home.
Original Mortgage
$30,290
Interest Rate
7.09%
Create a Home Valuation Report for This Property
The Home Valuation Report is an in-depth analysis detailing your home's value as well as a comparison with similar homes in the area
Home Values in the Area
Average Home Value in this Area
Purchase History
| Date | Buyer | Sale Price | Title Company |
|---|---|---|---|
| Markowicz Michael W | $125,000 | -- |
Source: Public Records
Mortgage History
| Date | Status | Borrower | Loan Amount |
|---|---|---|---|
| Open | Markowicz Michael W | $152,000 | |
| Closed | Markowicz Michael W | $151,000 | |
| Closed | Markowicz Michael W | $30,290 | |
| Closed | Markowicz Michael W | $118,750 |
Source: Public Records
Tax History Compared to Growth
Tax History
| Year | Tax Paid | Tax Assessment Tax Assessment Total Assessment is a certain percentage of the fair market value that is determined by local assessors to be the total taxable value of land and additions on the property. | Land | Improvement |
|---|---|---|---|---|
| 2025 | $4,219 | $308,600 | $176,000 | $132,600 |
| 2024 | $4,191 | $302,800 | $169,200 | $133,600 |
| 2023 | $4,186 | $289,700 | $169,200 | $120,500 |
| 2022 | $4,257 | $272,900 | $153,900 | $119,000 |
| 2021 | $4,300 | $252,200 | $147,900 | $104,300 |
| 2020 | $4,297 | $248,500 | $142,200 | $106,300 |
| 2019 | $4,155 | $236,600 | $135,900 | $100,700 |
| 2018 | $6 | $228,100 | $135,900 | $92,200 |
| 2017 | $4,008 | $219,000 | $129,600 | $89,400 |
| 2016 | $3,923 | $216,000 | $129,600 | $86,400 |
| 2015 | $3,813 | $214,700 | $128,700 | $86,000 |
| 2014 | $3,712 | $213,700 | $126,000 | $87,700 |
Source: Public Records
Map
Nearby Homes
- 446 Elm St
- 416 Highland St
- 11 Willow Ave
- 25 Plain St
- 585 N Bedford St
- 11 Harmony Crossing
- 20 Plain St
- 611 N Bedford St
- 41 Bedford St
- 505 N Central St
- 407 W Union St
- 848 N Bedford St Phase III
- 848 N Bedford St
- 848 N Bedford St Phase IV
- 848 N
- 50 Belmont St
- 71 Church St
- 282 Spring St
- 9 Hemlock Dr
- 14 Mountain Ash Rd