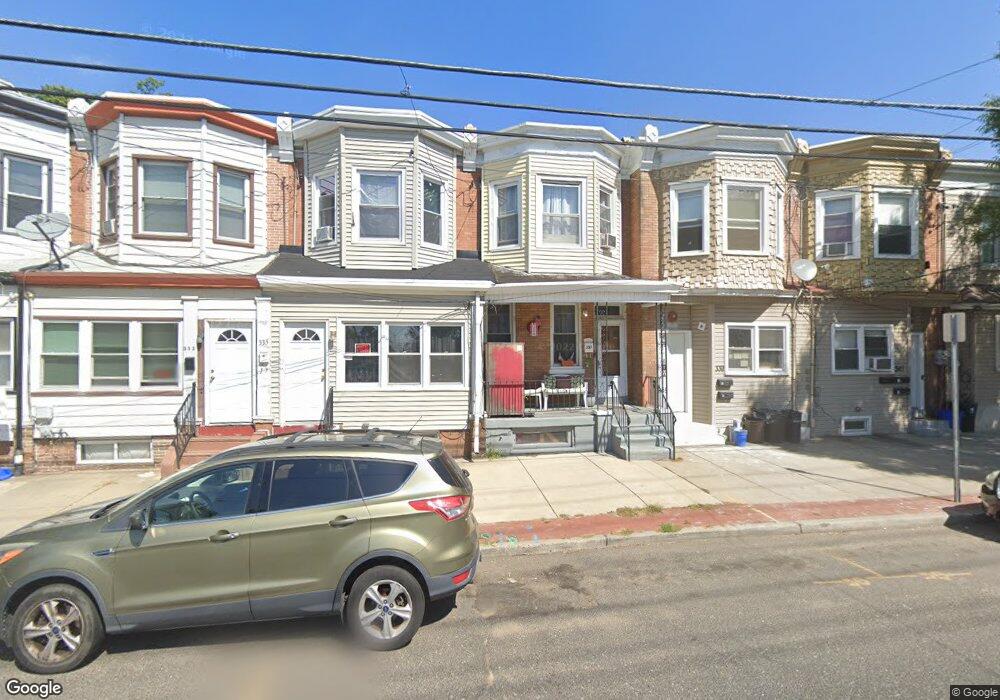
337 Market St Gloucester City, NJ 08030
Estimated Value: $160,781 - $197,000
--
Bed
--
Bath
1,115
Sq Ft
$161/Sq Ft
Est. Value
About This Home
This home is located at 337 Market St, Gloucester City, NJ 08030 and is currently estimated at $179,945, approximately $161 per square foot. 337 Market St is a home located in Camden County with nearby schools including Cold Springs School, Gloucester City Middle School, and Gloucester City Junior/Senior High School.
Ownership History
Date
Name
Owned For
Owner Type
Purchase Details
Closed on
Dec 22, 2006
Sold by
Nelson Donald R
Bought by
Nelson Andrew
Current Estimated Value
Home Financials for this Owner
Home Financials are based on the most recent Mortgage that was taken out on this home.
Original Mortgage
$74,411
Interest Rate
6.4%
Mortgage Type
FHA
Purchase Details
Closed on
Jul 17, 2003
Sold by
Schissler John
Bought by
Nelson Donald R and Nelson Catherine F
Home Financials for this Owner
Home Financials are based on the most recent Mortgage that was taken out on this home.
Original Mortgage
$52,200
Interest Rate
5.28%
Create a Home Valuation Report for This Property
The Home Valuation Report is an in-depth analysis detailing your home's value as well as a comparison with similar homes in the area
Home Values in the Area
Average Home Value in this Area
Purchase History
| Date | Buyer | Sale Price | Title Company |
|---|---|---|---|
| Nelson Andrew | $75,000 | -- | |
| Nelson Donald R | $58,000 | -- |
Source: Public Records
Mortgage History
| Date | Status | Borrower | Loan Amount |
|---|---|---|---|
| Previous Owner | Nelson Andrew | $74,411 | |
| Previous Owner | Nelson Donald R | $52,200 |
Source: Public Records
Tax History Compared to Growth
Tax History
| Year | Tax Paid | Tax Assessment Tax Assessment Total Assessment is a certain percentage of the fair market value that is determined by local assessors to be the total taxable value of land and additions on the property. | Land | Improvement |
|---|---|---|---|---|
| 2025 | $3,198 | $63,800 | $9,500 | $54,300 |
| 2024 | $3,193 | $63,800 | $9,500 | $54,300 |
| 2023 | $3,193 | $63,800 | $9,500 | $54,300 |
| 2022 | $3,002 | $63,800 | $9,500 | $54,300 |
| 2021 | $2,972 | $63,800 | $9,500 | $54,300 |
| 2020 | $2,870 | $63,800 | $9,500 | $54,300 |
| 2019 | $2,811 | $63,800 | $9,500 | $54,300 |
| 2018 | $2,756 | $63,800 | $9,500 | $54,300 |
| 2017 | $2,699 | $63,800 | $9,500 | $54,300 |
| 2016 | $2,597 | $63,800 | $9,500 | $54,300 |
| 2015 | $2,339 | $63,800 | $9,500 | $54,300 |
| 2014 | $2,366 | $45,100 | $7,500 | $37,600 |
Source: Public Records
Map
Nearby Homes
- 412 Market St
- 316 Ridgeway St
- 314 Ridgeway St
- 312 Ridgeway St
- 424 Hunter St
- 405 Jersey Ave
- 225 Market St
- 228 Orange St
- 328 Jersey Ave
- 326 Jersey Ave
- 619 Powell St
- 614 Hunter St
- 217 Cumberland St
- 218 Somerset St
- 325 Monmouth St
- 30 S Broadway
- 223 Ridgeway St
- 724 Hunter St
- 508 Bergen St
- 30 S Railroad Ave