Estimated Value: $561,622 - $621,000
3
Beds
2
Baths
1,548
Sq Ft
$384/Sq Ft
Est. Value
About This Home
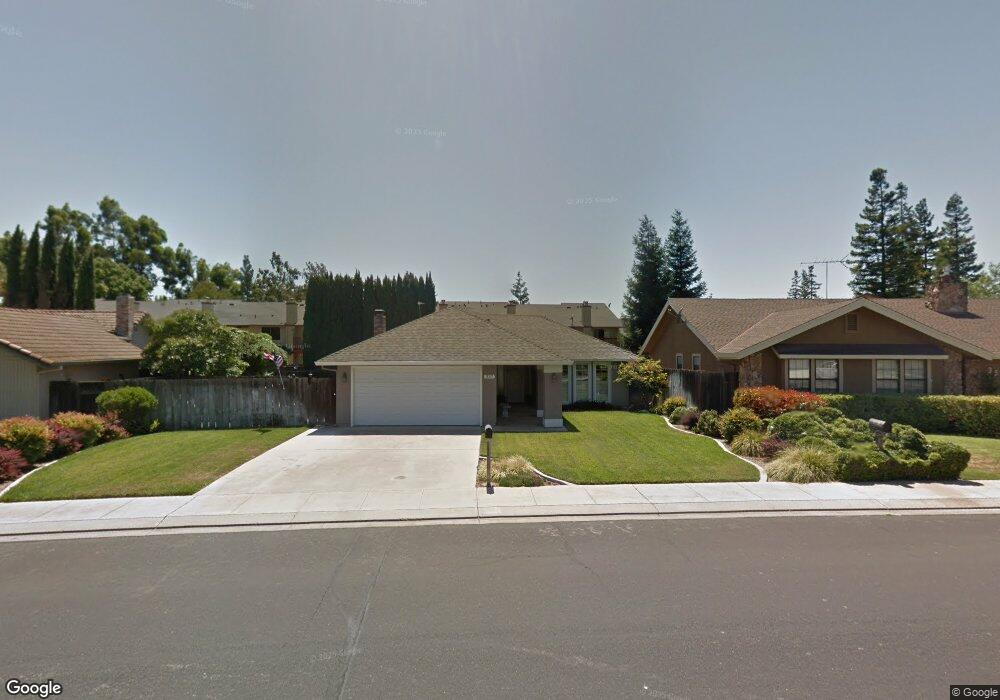
This home is located at 337 Oak St, Ripon, CA 95366 and is currently estimated at $593,906, approximately $383 per square foot. 337 Oak St is a home located in San Joaquin County with nearby schools including Ripona Elementary School, Ripon Elementary School, and Colony Oak Elementary School.
Ownership History
Date
Name
Owned For
Owner Type
Purchase Details
Closed on
Oct 25, 2006
Sold by
Hubers Jeffrey L and Hubers Carla M
Bought by
Hubers Jeffrey L and Hubers Carla M
Current Estimated Value
Home Financials for this Owner
Home Financials are based on the most recent Mortgage that was taken out on this home.
Original Mortgage
$60,000
Interest Rate
6.39%
Mortgage Type
New Conventional
Purchase Details
Closed on
Dec 9, 2005
Sold by
Hubers Jeffrey L and Hubers Carla M
Bought by
Hubers Jeffrey L and Hubers Carla M
Create a Home Valuation Report for This Property
The Home Valuation Report is an in-depth analysis detailing your home's value as well as a comparison with similar homes in the area
Home Values in the Area
Average Home Value in this Area
Purchase History
| Date | Buyer | Sale Price | Title Company |
|---|---|---|---|
| Hubers Jeffrey L | -- | Accommodation | |
| Hubers Jeffrey L | -- | Placer Title Company | |
| Hubers Jeffrey L | -- | -- |
Source: Public Records
Mortgage History
| Date | Status | Borrower | Loan Amount |
|---|---|---|---|
| Closed | Hubers Jeffrey L | $60,000 |
Source: Public Records
Tax History
| Year | Tax Paid | Tax Assessment Tax Assessment Total Assessment is a certain percentage of the fair market value that is determined by local assessors to be the total taxable value of land and additions on the property. | Land | Improvement |
|---|---|---|---|---|
| 2025 | $2,726 | $252,471 | $99,184 | $153,287 |
| 2024 | $2,681 | $247,522 | $97,240 | $150,282 |
| 2023 | $2,626 | $242,670 | $95,334 | $147,336 |
| 2022 | $2,583 | $237,913 | $93,465 | $144,448 |
| 2021 | $2,542 | $233,249 | $91,633 | $141,616 |
| 2020 | $2,519 | $230,858 | $90,694 | $140,164 |
| 2019 | $2,475 | $226,332 | $88,916 | $137,416 |
| 2018 | $2,436 | $221,895 | $87,173 | $134,722 |
| 2017 | $2,389 | $217,545 | $85,464 | $132,081 |
| 2016 | $2,348 | $213,281 | $83,789 | $129,492 |
| 2014 | $2,258 | $205,963 | $80,914 | $125,049 |
Source: Public Records
Map
Nearby Homes
- 244 California St
- 163 Franklin Ln
- 410 Pine St
- 205 3rd St
- 788 E Milgeo Ave
- 150 N Acacia Ave
- 845 Sunrise Ave
- 346 S Manley Rd
- 749 Nancy Dr
- 446 Meyenberg Ave
- 565 Bodeson Ct
- 1234 Murphy Rd
- 2345 Murphy Rd
- 1720 Fairway Oaks Ct
- 960 Goodwin Dr
- 183 Haller Ct
- 547 Sepp Ct
- 916 6th St
- 1537 Atlantic Ave
- 138 Roxie Ct
Your Personal Tour Guide
Ask me questions while you tour the home.