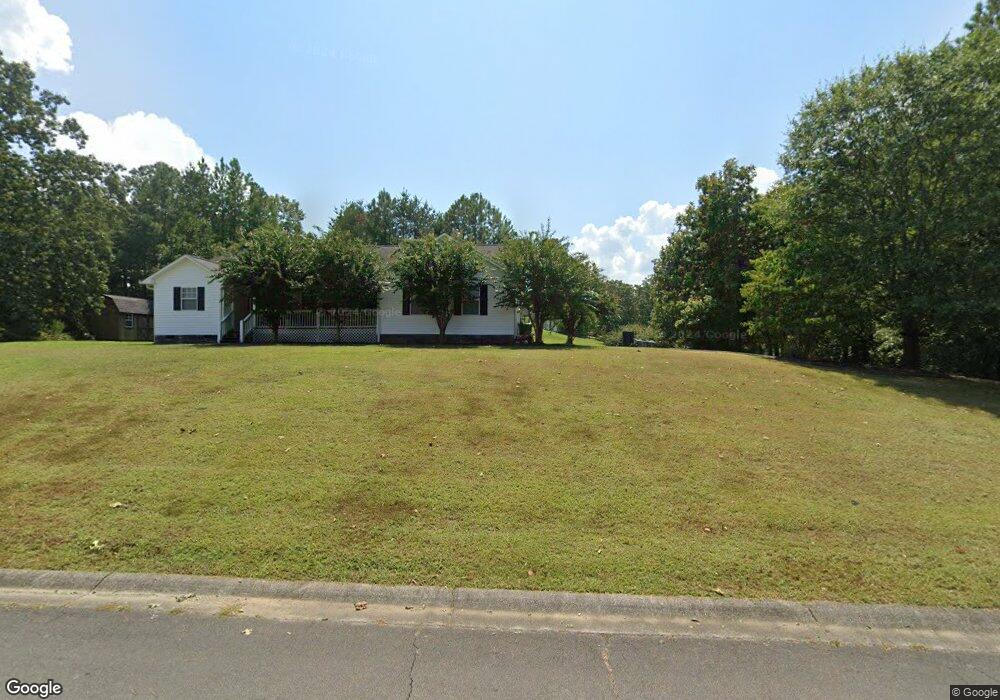
337 Oakland Dr SE Calhoun, GA 30701
Estimated Value: $340,234 - $390,000
4
Beds
3
Baths
2,319
Sq Ft
$159/Sq Ft
Est. Value
About This Home
This home is located at 337 Oakland Dr SE, Calhoun, GA 30701 and is currently estimated at $369,559, approximately $159 per square foot. 337 Oakland Dr SE is a home located in Gordon County with nearby schools including Sonoraville Elementary School, Red Bud Middle School, and Sonoraville High School.
Ownership History
Date
Name
Owned For
Owner Type
Purchase Details
Closed on
Feb 2, 2006
Sold by
Leonard Shannon D
Bought by
Leonard Shannon D and Leonard Kerry F
Current Estimated Value
Purchase Details
Closed on
Jan 14, 2005
Sold by
Federal Home Loan Mortgage Corporation
Bought by
Leonard Shannon D
Home Financials for this Owner
Home Financials are based on the most recent Mortgage that was taken out on this home.
Original Mortgage
$70,000
Outstanding Balance
$35,038
Interest Rate
5.62%
Mortgage Type
New Conventional
Estimated Equity
$334,521
Purchase Details
Closed on
May 4, 2004
Sold by
Taylor Bean and Whitaker Mortgag
Bought by
Federal Home Loan Mortgage Corp
Purchase Details
Closed on
Mar 29, 2002
Sold by
Dulin Mike
Bought by
Vickers Mary Lou
Purchase Details
Closed on
Oct 12, 2000
Sold by
Craig Richard L and Craig Sue
Bought by
Dulin Mike
Create a Home Valuation Report for This Property
The Home Valuation Report is an in-depth analysis detailing your home's value as well as a comparison with similar homes in the area
Home Values in the Area
Average Home Value in this Area
Purchase History
| Date | Buyer | Sale Price | Title Company |
|---|---|---|---|
| Leonard Shannon D | -- | -- | |
| Leonard Shannon D | $132,900 | -- | |
| Federal Home Loan Mortgage Corp | -- | -- | |
| Taylor Bean & Whitaker Mortgage Corp | -- | -- | |
| Vickers Mary Lou | $132,000 | -- | |
| Dulin Mike | $14,000 | -- |
Source: Public Records
Mortgage History
| Date | Status | Borrower | Loan Amount |
|---|---|---|---|
| Open | Leonard Shannon D | $70,000 |
Source: Public Records
Tax History Compared to Growth
Tax History
| Year | Tax Paid | Tax Assessment Tax Assessment Total Assessment is a certain percentage of the fair market value that is determined by local assessors to be the total taxable value of land and additions on the property. | Land | Improvement |
|---|---|---|---|---|
| 2024 | $2,973 | $119,024 | $7,960 | $111,064 |
| 2023 | $2,771 | $111,068 | $7,960 | $103,108 |
| 2022 | $2,613 | $98,712 | $7,600 | $91,112 |
| 2021 | $1,933 | $70,988 | $5,040 | $65,948 |
| 2020 | $1,885 | $67,784 | $4,760 | $63,024 |
| 2019 | $2,236 | $79,644 | $5,600 | $74,044 |
| 2018 | $2,053 | $73,292 | $5,600 | $67,692 |
| 2017 | $1,995 | $69,332 | $5,600 | $63,732 |
| 2016 | $2,000 | $69,332 | $5,600 | $63,732 |
| 2015 | $1,978 | $67,972 | $5,600 | $62,372 |
| 2014 | $1,838 | $65,128 | $5,600 | $59,528 |
Source: Public Records
Map
Nearby Homes
- 478 Oakland Dr SE
- 153 Oakland Dr SE
- 311 Langston Rd SE
- 0 Covington Bridge Rd SE Unit 10558075
- 0 Covington Bridge Rd SE Unit 7610123
- 194 Cardinal Blvd SE
- 192 Cardinal Blvd SE
- 408 Peachtree Ln SE
- 264 Boone Ford Rd SE
- 191 Frix Ln SE
- 190 Woodford Way SE
- 177 Frix Ln SE
- 140 Grist Mill Ln SE
- 166 Woodford Way SE
- 4134 Dews Pond Rd SE
- 145 Water Wheel Ln SE
- 135 Grist Mill Ln SE
- 0 Buck Blvd SE Unit 7362017
- 0 Buck Blvd SE Unit 10275210
- 137 Hunters Trail SE
- 347 Oakland Dr SE
- 357 Oakland Dr SE
- 330 Oakland Dr SE
- 315 Oakland Dr SE
- 327 Oakland Dr SE
- 369 Oakland Dr SE
- 382 Oakland Dr SE
- 381 Oakland Dr SE
- 33 Savannah St SE
- 32 Savannah St SE
- 42 Savannah St SE
- 370 Oakland Dr SE
- 129 Savannah St SE
- 393 Oakland Dr SE
- 141 Savannah St SE
- 116 Savannah St SE
- 116 Savannah St SE Unit 44
- 267 Oakland Dr SE
- 405 Oakland Dr SE
- 454 Oakland Dr SE