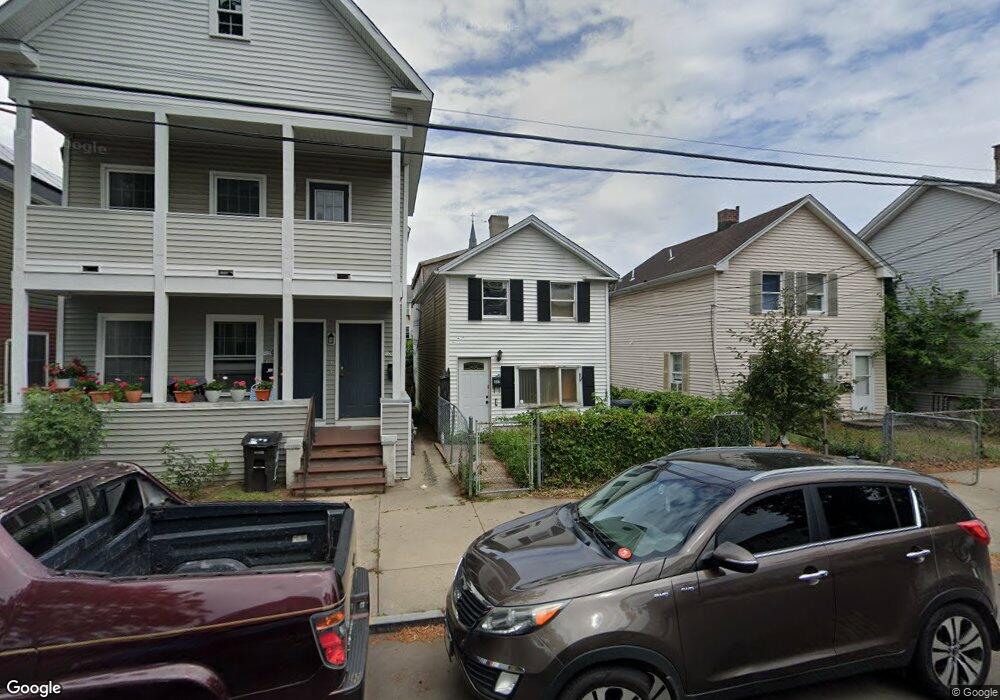
337 Poplar St New Haven, CT 06513
Fair Haven NeighborhoodEstimated Value: $157,000 - $263,000
2
Beds
2
Baths
1,398
Sq Ft
$151/Sq Ft
Est. Value
About This Home
This home is located at 337 Poplar St, New Haven, CT 06513 and is currently estimated at $211,090, approximately $150 per square foot. 337 Poplar St is a home located in New Haven County with nearby schools including Clinton Avenue School, Elm City College Preparatory School, and St Francis & St Rose Of Lima School.
Ownership History
Date
Name
Owned For
Owner Type
Purchase Details
Closed on
Aug 19, 2009
Sold by
Us Bank Na
Bought by
Rivera Jose
Current Estimated Value
Purchase Details
Closed on
Jan 8, 2009
Sold by
Quiles Domingo and Quiles Darlene
Bought by
Us Bank Na
Purchase Details
Closed on
Jan 2, 2003
Sold by
Davia Carl
Bought by
Pascual Federico and Pascual Lourdes
Home Financials for this Owner
Home Financials are based on the most recent Mortgage that was taken out on this home.
Original Mortgage
$63,995
Interest Rate
6.08%
Create a Home Valuation Report for This Property
The Home Valuation Report is an in-depth analysis detailing your home's value as well as a comparison with similar homes in the area
Home Values in the Area
Average Home Value in this Area
Purchase History
| Date | Buyer | Sale Price | Title Company |
|---|---|---|---|
| Rivera Jose | $23,100 | -- | |
| Us Bank Na | -- | -- | |
| Pascual Federico | $65,000 | -- |
Source: Public Records
Mortgage History
| Date | Status | Borrower | Loan Amount |
|---|---|---|---|
| Previous Owner | Pascual Federico | $15,000 | |
| Previous Owner | Pascual Federico | $63,995 |
Source: Public Records
Tax History Compared to Growth
Tax History
| Year | Tax Paid | Tax Assessment Tax Assessment Total Assessment is a certain percentage of the fair market value that is determined by local assessors to be the total taxable value of land and additions on the property. | Land | Improvement |
|---|---|---|---|---|
| 2025 | $3,381 | $85,820 | $26,040 | $59,780 |
| 2024 | $3,304 | $85,820 | $26,040 | $59,780 |
| 2023 | $3,193 | $85,820 | $26,040 | $59,780 |
| 2022 | $3,411 | $85,820 | $26,040 | $59,780 |
| 2021 | $3,406 | $77,630 | $20,790 | $56,840 |
| 2020 | $3,406 | $77,630 | $20,790 | $56,840 |
| 2019 | $3,337 | $77,630 | $20,790 | $56,840 |
| 2018 | $3,337 | $77,630 | $20,790 | $56,840 |
| 2017 | $3,003 | $77,630 | $20,790 | $56,840 |
| 2016 | $2,781 | $66,920 | $13,860 | $53,060 |
| 2015 | $2,781 | $66,920 | $13,860 | $53,060 |
| 2014 | $2,781 | $66,920 | $13,860 | $53,060 |
Source: Public Records
Map
Nearby Homes