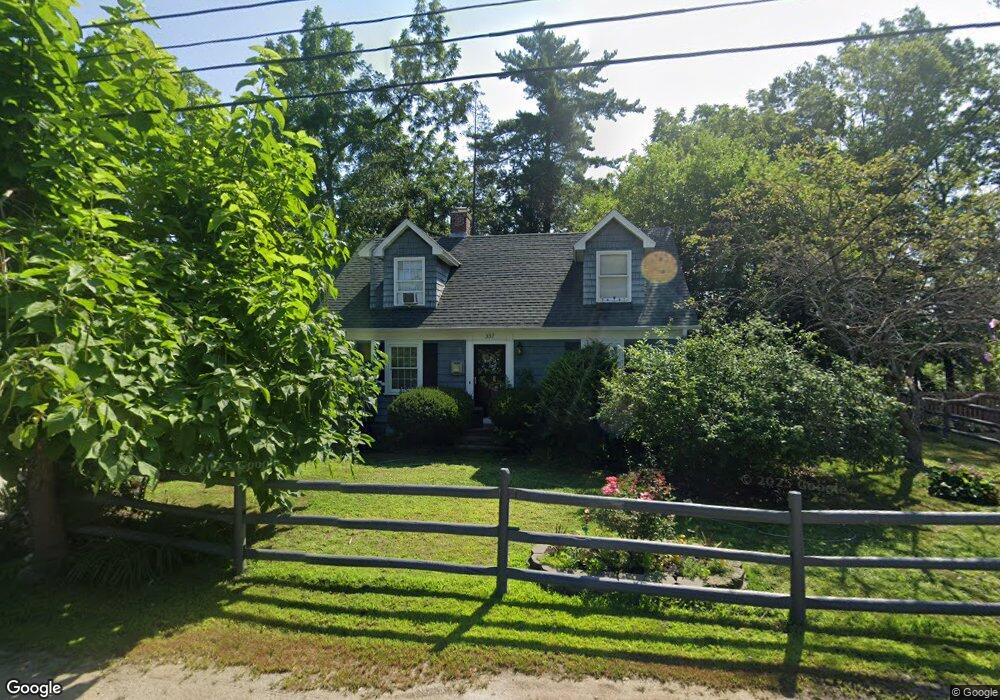
337 S Main St Concord, NH 03301
South End NeighborhoodEstimated Value: $477,227 - $508,000
4
Beds
2
Baths
1,734
Sq Ft
$286/Sq Ft
Est. Value
About This Home
This home is located at 337 S Main St, Concord, NH 03301 and is currently estimated at $495,057, approximately $285 per square foot. 337 S Main St is a home located in Merrimack County with nearby schools including Abbot-Downing School, Rundlett Middle School, and Concord High School.
Ownership History
Date
Name
Owned For
Owner Type
Purchase Details
Closed on
Jan 13, 2017
Sold by
Stoney Corinne F
Bought by
Oasis 2016 T
Current Estimated Value
Purchase Details
Closed on
Aug 30, 2012
Sold by
Stoney William T
Bought by
Greco Vincent and Manseau Patricia
Create a Home Valuation Report for This Property
The Home Valuation Report is an in-depth analysis detailing your home's value as well as a comparison with similar homes in the area
Home Values in the Area
Average Home Value in this Area
Purchase History
| Date | Buyer | Sale Price | Title Company |
|---|---|---|---|
| Oasis 2016 T | -- | -- | |
| Greco Vincent | $310,000 | -- |
Source: Public Records
Mortgage History
| Date | Status | Borrower | Loan Amount |
|---|---|---|---|
| Previous Owner | Greco Vincent | $193,000 | |
| Previous Owner | Greco Vincent | $232,000 | |
| Previous Owner | Greco Vincent | $25,800 |
Source: Public Records
Tax History
| Year | Tax Paid | Tax Assessment Tax Assessment Total Assessment is a certain percentage of the fair market value that is determined by local assessors to be the total taxable value of land and additions on the property. | Land | Improvement |
|---|---|---|---|---|
| 2025 | $8,634 | $296,600 | $85,000 | $211,600 |
| 2024 | $8,213 | $296,600 | $85,000 | $211,600 |
| 2023 | $7,967 | $296,600 | $85,000 | $211,600 |
| 2022 | $7,679 | $296,600 | $85,000 | $211,600 |
| 2021 | $7,403 | $294,700 | $85,000 | $209,700 |
| 2020 | $7,407 | $276,800 | $71,800 | $205,000 |
| 2019 | $7,039 | $253,400 | $70,200 | $183,200 |
| 2018 | $6,455 | $234,300 | $70,200 | $164,100 |
| 2017 | $6,396 | $226,500 | $69,000 | $157,500 |
| 2016 | $5,807 | $215,300 | $69,000 | $146,300 |
| 2015 | $5,589 | $207,800 | $62,700 | $145,100 |
| 2014 | $5,421 | $207,800 | $62,700 | $145,100 |
| 2013 | -- | $204,100 | $62,700 | $141,400 |
| 2012 | -- | $205,700 | $62,700 | $143,000 |
Source: Public Records
Map
Nearby Homes
- 335 S Main St
- 11 Fellows St
- 33 Joffre St
- 273-279 S Main St
- 0 South St Unit 4969509
- 40 Nivelle St
- 2 Goldenrod Ln
- 289 South St
- 20 Cypress St
- 4 Princeton St
- 3 Yale St
- 111 -113 South Main St
- 47 South St
- 17-19 Thompson St
- 6 Lincoln St
- 6 Centerwood Dr
- 2 S Spring St
- 21 Fairfield Dr
- 22 Fairfield Dr
- 20 Fairfield Dr
Your Personal Tour Guide
Ask me questions while you tour the home.