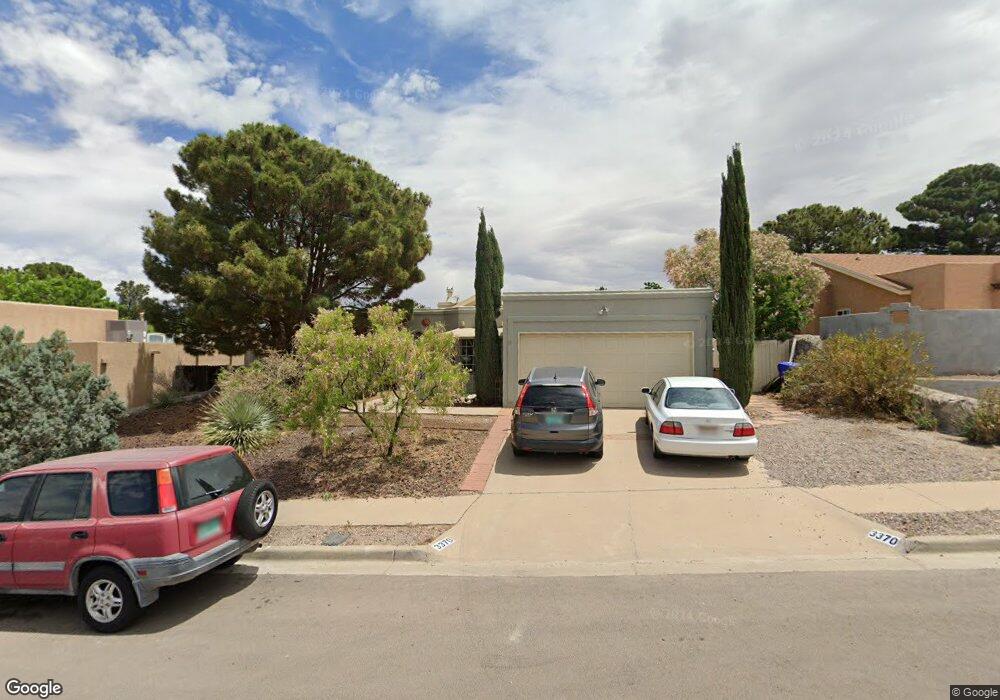
3370 Solarridge St Las Cruces, NM 88012
Estimated Value: $243,790 - $254,000
3
Beds
2
Baths
1,403
Sq Ft
$177/Sq Ft
Est. Value
About This Home
This home is located at 3370 Solarridge St, Las Cruces, NM 88012 and is currently estimated at $248,895, approximately $177 per square foot. 3370 Solarridge St is a home located in Dona Ana County with nearby schools including Highland Elementary School, Camino Real Middle School, and Organ Mountain High School.
Ownership History
Date
Name
Owned For
Owner Type
Purchase Details
Closed on
Oct 6, 2009
Sold by
Wilkey Dean W
Bought by
Wilkey Dean W and Wilkey Jean Reece
Current Estimated Value
Home Financials for this Owner
Home Financials are based on the most recent Mortgage that was taken out on this home.
Original Mortgage
$99,400
Outstanding Balance
$65,171
Interest Rate
5.16%
Mortgage Type
New Conventional
Estimated Equity
$183,724
Purchase Details
Closed on
Sep 17, 2008
Sold by
Embrey Paula
Bought by
Embrey Paula
Purchase Details
Closed on
Aug 2, 2000
Sold by
Dreher Willard G and Dreher Pauline H
Bought by
Dreher Pauline and Embrey Paula B
Purchase Details
Closed on
Jul 18, 2000
Sold by
Dreher Alan
Bought by
Dreher Pauline H
Purchase Details
Closed on
Jul 17, 2000
Sold by
Galloway Carol
Bought by
Dreher Pauline H
Create a Home Valuation Report for This Property
The Home Valuation Report is an in-depth analysis detailing your home's value as well as a comparison with similar homes in the area
Home Values in the Area
Average Home Value in this Area
Purchase History
| Date | Buyer | Sale Price | Title Company |
|---|---|---|---|
| Wilkey Dean W | -- | Southwestern Abstract & Titl | |
| Wilkey Dean W | -- | Southwestern Abstract & Titl | |
| Embrey Paula | -- | None Available | |
| Dreher Pauline | -- | -- | |
| Dreher Pauline H | -- | -- | |
| Dreher Pauline H | -- | -- |
Source: Public Records
Mortgage History
| Date | Status | Borrower | Loan Amount |
|---|---|---|---|
| Open | Wilkey Dean W | $99,400 |
Source: Public Records
Tax History Compared to Growth
Tax History
| Year | Tax Paid | Tax Assessment Tax Assessment Total Assessment is a certain percentage of the fair market value that is determined by local assessors to be the total taxable value of land and additions on the property. | Land | Improvement |
|---|---|---|---|---|
| 2024 | $1,471 | $50,308 | $9,940 | $40,368 |
| 2023 | $1,449 | $48,843 | $9,866 | $38,977 |
| 2022 | $1,425 | $47,420 | $9,830 | $37,590 |
| 2021 | $1,377 | $46,039 | $9,796 | $36,243 |
| 2020 | $1,342 | $44,699 | $9,763 | $34,936 |
| 2019 | $1,345 | $44,699 | $9,763 | $34,936 |
| 2018 | $1,296 | $43,397 | $9,731 | $33,666 |
| 2017 | $1,190 | $43,397 | $9,731 | $33,666 |
| 2016 | $1,169 | $42,133 | $9,700 | $32,433 |
| 2015 | $1,175 | $126,400 | $29,100 | $97,300 |
| 2014 | $1,175 | $126,400 | $29,100 | $97,300 |
Source: Public Records
Map
Nearby Homes
- 3339 Solarridge St
- 3373 Lunarridge St
- 3209 Neptune Dr
- 3301 Jupiter Rd
- 3910 Powder Horn Ct
- 2212 Uranus Ave
- 3327 Venus St
- 3317 Venus St
- 3541 Venus St
- 2108 Pine Needle Way
- 2093 Pine Needle Way
- 2348 Flintstone Loop
- 2136 Whitstone Dr
- 2180 Stone Pine Dr
- 2194 Foxtail Pine Dr
- 2195 Foxtail Pine Dr
- 1905 Settlers Bend N
- TBD Conocito Place
- 3495 Bataan Memorial W
- 2226 Foxtail Pine Dr
- 3360 Solarridge St
- 3382 Solarridge St
- 3355 Highridge St
- 3351 Highridge St
- 3356 Solarridge St
- 3345 Highridge St
- 3396 Solarridge St
- 3363 Solarridge St
- 3361 Highridge St
- 3373 Solarridge St
- 3359 Solarridge St
- 3341 Highridge St
- 3385 Solarridge St
- 3344 Solarridge St
- 3347 Solarridge St
- 3358 Highridge St
- 3352 Highridge St
- 3335 Highridge St
- 3397 Solarridge St
- 3362 Highridge St