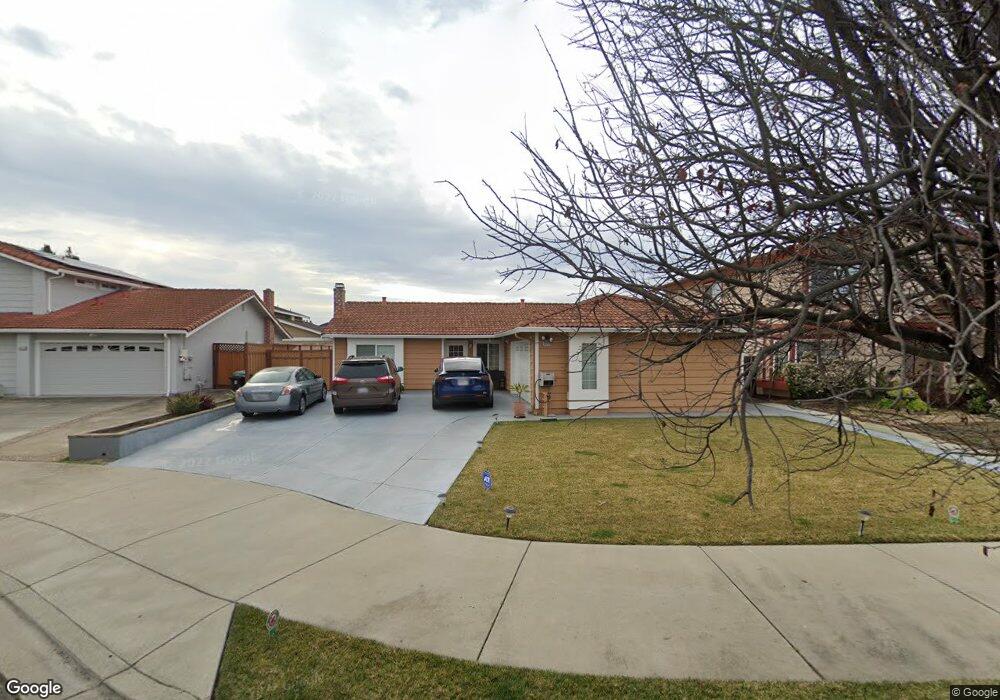
33703 Simple Ct Fremont, CA 94555
Ardenwood NeighborhoodEstimated Value: $1,485,671 - $1,838,000
3
Beds
2
Baths
1,480
Sq Ft
$1,103/Sq Ft
Est. Value
About This Home
This home is located at 33703 Simple Ct, Fremont, CA 94555 and is currently estimated at $1,632,418, approximately $1,102 per square foot. 33703 Simple Ct is a home located in Alameda County with nearby schools including Ardenwood Elementary, Thornton Middle School, and American High School.
Ownership History
Date
Name
Owned For
Owner Type
Purchase Details
Closed on
Jul 24, 2015
Sold by
Ho Nancy A and Ho Francisco L
Bought by
Shah Jigar C and Patel Dipti T
Current Estimated Value
Home Financials for this Owner
Home Financials are based on the most recent Mortgage that was taken out on this home.
Original Mortgage
$625,500
Outstanding Balance
$489,764
Interest Rate
3.98%
Mortgage Type
New Conventional
Estimated Equity
$1,142,654
Purchase Details
Closed on
Aug 11, 1998
Sold by
Chang Jason and Chang Hedy
Bought by
Ho Francisco L and Ho Nancy A
Home Financials for this Owner
Home Financials are based on the most recent Mortgage that was taken out on this home.
Original Mortgage
$234,400
Interest Rate
6.91%
Purchase Details
Closed on
Oct 27, 1993
Sold by
Chang Jason and Chang Hedy
Bought by
Chang Jason and Chang Hedy
Create a Home Valuation Report for This Property
The Home Valuation Report is an in-depth analysis detailing your home's value as well as a comparison with similar homes in the area
Home Values in the Area
Average Home Value in this Area
Purchase History
| Date | Buyer | Sale Price | Title Company |
|---|---|---|---|
| Shah Jigar C | $992,000 | Fidelity National Title Co | |
| Ho Francisco L | $293,000 | Fidelity National Title Co | |
| Chang Jason | -- | -- | |
| Chang Jason | -- | -- |
Source: Public Records
Mortgage History
| Date | Status | Borrower | Loan Amount |
|---|---|---|---|
| Open | Shah Jigar C | $625,500 | |
| Previous Owner | Ho Francisco L | $234,400 |
Source: Public Records
Tax History
| Year | Tax Paid | Tax Assessment Tax Assessment Total Assessment is a certain percentage of the fair market value that is determined by local assessors to be the total taxable value of land and additions on the property. | Land | Improvement |
|---|---|---|---|---|
| 2025 | $13,783 | $1,167,299 | $378,806 | $795,493 |
| 2024 | $13,783 | $1,144,275 | $371,379 | $779,896 |
| 2023 | $13,422 | $1,128,707 | $364,099 | $764,608 |
| 2022 | $13,260 | $1,099,576 | $356,960 | $749,616 |
| 2021 | $12,931 | $1,077,880 | $349,961 | $734,919 |
| 2020 | $13,008 | $1,073,760 | $346,374 | $727,386 |
| 2019 | $12,857 | $1,052,710 | $339,584 | $713,126 |
| 2018 | $12,607 | $1,032,076 | $332,928 | $699,148 |
| 2017 | $12,291 | $1,011,840 | $326,400 | $685,440 |
| 2016 | $12,170 | $992,000 | $320,000 | $672,000 |
| 2015 | $4,949 | $382,183 | $114,655 | $267,528 |
| 2014 | $4,857 | $374,697 | $112,409 | $262,288 |
Source: Public Records
Map
Nearby Homes
- 4940 Bunkhouse St
- 33038 Garfinkle St
- 4819 Kenwood St
- 4822 La Habra St
- 34203 Petard Terrace
- 34184 Duke Ln
- 4141 Deep Creek Rd Unit 89
- 4141 Deep Creek Rd Unit 106
- 4141 Deep Creek Rd Unit 84
- 5358 Matthew Terrace
- 5410 Buckner Terrace
- 4900 Creekwood Dr
- 4691 Rousillon Ave
- 4229 Tanager Common
- 4235 Tanager Common
- 4469 Fellows St
- 4600 Delores Dr
- 34671 Agree Terrace
- 3868 Fiano Common
- 5220 Fairbanks Common
- 33697 Simple Ct
- 33709 Simple Ct
- 33724 Pistol Ct
- 33730 Pistol Ct
- 33718 Pistol Ct
- 33691 Simple Ct
- 33712 Pistol Ct
- 33736 Pistol Ct
- 33685 Simple Ct
- 33715 Slender Ct
- 33662 Simple Ct
- 33658 Simple Ct
- 33706 Pistol Ct
- 33652 Simple Ct
- 33666 Slender Ct
- 33679 Simple Ct
- 33721 Slender Ct
- 33742 Pistol Ct
- 33766 Shallow Ct
- 33646 Simple Ct
Your Personal Tour Guide
Ask me questions while you tour the home.