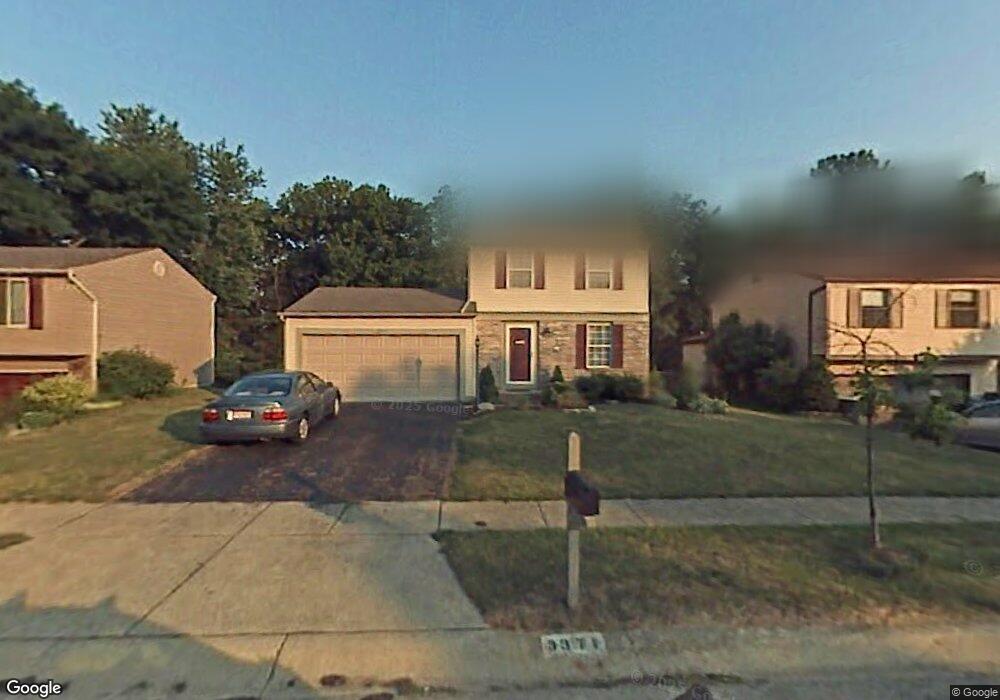
3371 Rudon Ln Columbus, OH 43204
Estimated Value: $263,280 - $317,000
3
Beds
2
Baths
1,640
Sq Ft
$178/Sq Ft
Est. Value
About This Home
This home is located at 3371 Rudon Ln, Columbus, OH 43204 and is currently estimated at $291,320, approximately $177 per square foot. 3371 Rudon Ln is a home located in Franklin County with nearby schools including Prairie Lincoln Elementary School, Galloway Ridge Intermediate School, and Norton Middle School.
Ownership History
Date
Name
Owned For
Owner Type
Purchase Details
Closed on
Jun 27, 2008
Sold by
Kirtland Stephen P and Kirtland Lydie
Bought by
Copeland Angela M
Current Estimated Value
Home Financials for this Owner
Home Financials are based on the most recent Mortgage that was taken out on this home.
Original Mortgage
$128,976
Outstanding Balance
$82,741
Interest Rate
5.96%
Mortgage Type
FHA
Estimated Equity
$208,579
Purchase Details
Closed on
Jun 28, 2002
Sold by
Hud
Bought by
Kirtland Stephen P and Kirtland Lydie
Home Financials for this Owner
Home Financials are based on the most recent Mortgage that was taken out on this home.
Original Mortgage
$93,903
Interest Rate
6.82%
Mortgage Type
FHA
Purchase Details
Closed on
Nov 29, 2001
Sold by
Greene John W
Bought by
Hud
Purchase Details
Closed on
Sep 9, 1992
Bought by
Greene John W
Purchase Details
Closed on
Jul 1, 1985
Create a Home Valuation Report for This Property
The Home Valuation Report is an in-depth analysis detailing your home's value as well as a comparison with similar homes in the area
Home Values in the Area
Average Home Value in this Area
Purchase History
| Date | Buyer | Sale Price | Title Company |
|---|---|---|---|
| Copeland Angela M | $131,000 | Crown Searc | |
| Kirtland Stephen P | $95,000 | Contract Processing & Title | |
| Hud | $62,600 | -- | |
| Greene John W | $76,000 | -- | |
| -- | $59,900 | -- |
Source: Public Records
Mortgage History
| Date | Status | Borrower | Loan Amount |
|---|---|---|---|
| Open | Copeland Angela M | $128,976 | |
| Previous Owner | Kirtland Stephen P | $93,903 |
Source: Public Records
Tax History Compared to Growth
Tax History
| Year | Tax Paid | Tax Assessment Tax Assessment Total Assessment is a certain percentage of the fair market value that is determined by local assessors to be the total taxable value of land and additions on the property. | Land | Improvement |
|---|---|---|---|---|
| 2024 | $2,794 | $76,620 | $22,230 | $54,390 |
| 2023 | $2,744 | $76,615 | $22,225 | $54,390 |
| 2022 | $2,471 | $50,620 | $9,280 | $41,340 |
| 2021 | $2,520 | $50,620 | $9,280 | $41,340 |
| 2020 | $2,506 | $50,620 | $9,280 | $41,340 |
| 2019 | $2,408 | $42,920 | $7,740 | $35,180 |
| 2018 | $2,326 | $42,920 | $7,740 | $35,180 |
| 2017 | $2,321 | $42,920 | $7,740 | $35,180 |
| 2016 | $2,256 | $37,280 | $9,630 | $27,650 |
| 2015 | $2,256 | $37,280 | $9,630 | $27,650 |
| 2014 | $2,258 | $37,280 | $9,630 | $27,650 |
| 2013 | $1,245 | $41,440 | $10,710 | $30,730 |
Source: Public Records
Map
Nearby Homes
- 3307 Rudon Ln
- 664 N Wilson Rd
- 0 Lowell Dr Unit 223009270
- 355-357 N Algonquin Ave
- 1150 Romona Place
- 527 N Hague Ave
- 3570 Dover Rd
- 2875 Lowell Dr
- 3254 Dover Rd
- 3252 Dover Rd
- 160 N Sylvan Ave
- 3100 Steele Ave
- 154-156 N Huron Ave
- 66 N Brinker Ave
- 3161 Bowdoin Cir
- 162 S Roys Ave
- 75 N Huron Ave
- 43 Letchworth Ave
- 3757 Gibbstone Dr
- 3761 Gibbstone Dr