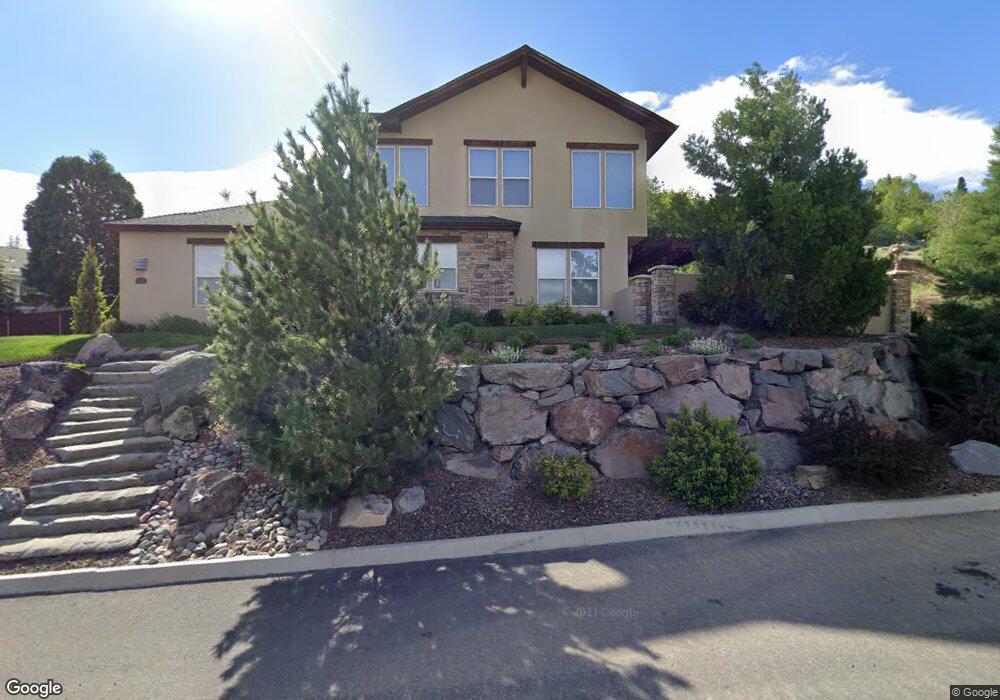
3372 Corey Dr Reno, NV 89509
Skyline Boulevard NeighborhoodEstimated Value: $1,050,130 - $1,293,000
4
Beds
3
Baths
3,011
Sq Ft
$388/Sq Ft
Est. Value
About This Home
This home is located at 3372 Corey Dr, Reno, NV 89509 and is currently estimated at $1,167,283, approximately $387 per square foot. 3372 Corey Dr is a home located in Washoe County with nearby schools including Jessie Beck Elementary School, Darrell C Swope Middle School, and Reno High School.
Ownership History
Date
Name
Owned For
Owner Type
Purchase Details
Closed on
Sep 10, 2013
Sold by
Byrne Dean and Byrne Claudia
Bought by
Byrne Dean and Byrne Claudia
Current Estimated Value
Purchase Details
Closed on
Apr 5, 2010
Sold by
Moore Christopher Martin and Moore Jaime Elaine
Bought by
Byrne Dean R and Byrne Claudia
Home Financials for this Owner
Home Financials are based on the most recent Mortgage that was taken out on this home.
Original Mortgage
$336,000
Outstanding Balance
$221,274
Interest Rate
5.01%
Mortgage Type
New Conventional
Estimated Equity
$946,009
Purchase Details
Closed on
Apr 7, 2005
Sold by
Fritz John and Fritz Melissa
Bought by
Moore Christopher Martin and Moore Jaime Elaine
Home Financials for this Owner
Home Financials are based on the most recent Mortgage that was taken out on this home.
Original Mortgage
$495,000
Interest Rate
5.84%
Mortgage Type
Fannie Mae Freddie Mac
Purchase Details
Closed on
Jul 26, 2004
Sold by
Hspd Investments Inc
Bought by
Fritz John and Fritz Melissa
Create a Home Valuation Report for This Property
The Home Valuation Report is an in-depth analysis detailing your home's value as well as a comparison with similar homes in the area
Home Values in the Area
Average Home Value in this Area
Purchase History
| Date | Buyer | Sale Price | Title Company |
|---|---|---|---|
| Byrne Dean | -- | None Available | |
| Byrne Dean | -- | None Available | |
| Byrne Dean R | $420,000 | First Centennial Reno | |
| Moore Christopher Martin | $245,000 | First Centennial Title Co | |
| Fritz John | $530,000 | First Centennial Title Co |
Source: Public Records
Mortgage History
| Date | Status | Borrower | Loan Amount |
|---|---|---|---|
| Open | Byrne Dean R | $336,000 | |
| Previous Owner | Moore Christopher Martin | $495,000 |
Source: Public Records
Tax History
| Year | Tax Paid | Tax Assessment Tax Assessment Total Assessment is a certain percentage of the fair market value that is determined by local assessors to be the total taxable value of land and additions on the property. | Land | Improvement |
|---|---|---|---|---|
| 2026 | $4,740 | $246,291 | $70,000 | $176,291 |
| 2024 | $5,966 | $240,993 | $61,250 | $179,743 |
| 2023 | $5,966 | $230,964 | $61,250 | $169,714 |
| 2022 | $5,791 | $193,820 | $52,500 | $141,320 |
| 2021 | $5,624 | $183,737 | $43,400 | $140,337 |
| 2020 | $5,457 | $183,709 | $43,400 | $140,309 |
| 2019 | $5,300 | $177,846 | $40,250 | $137,596 |
| 2018 | $5,144 | $166,290 | $32,219 | $134,071 |
| 2017 | $4,994 | $163,172 | $28,928 | $134,244 |
| 2016 | $4,868 | $160,938 | $25,037 | $135,901 |
| 2015 | $4,860 | $157,647 | $21,579 | $136,068 |
| 2014 | $4,719 | $154,194 | $22,810 | $131,384 |
| 2013 | -- | $133,624 | $17,357 | $116,267 |
Source: Public Records
Map
Nearby Homes
- 1762 Belford Rd
- 1742 Spyglass Cir
- 1425 Julie Ct
- 2693 Rodney Dr Unit 18-331-04
- 3255 Norman Dr
- 0 Markridge Dr Unit 230002663
- 3265 Markridge Dr
- 000 Markridge Dr
- 0 Marthiam Ave
- 2301 Solari Dr
- 2905 Susileen Dr
- 2345 Camelot Way
- 1281 Skyline Blvd
- 2390 Barnes Cir
- 3031 Cashill Blvd Unit B1
- 2350 Barnes Cir
- 0 Meridian Ln Unit 250054401
- 2201 Barnes Blvd
- 3149 Cashill Blvd
- 2360 Pioneer Dr
Your Personal Tour Guide
Ask me questions while you tour the home.