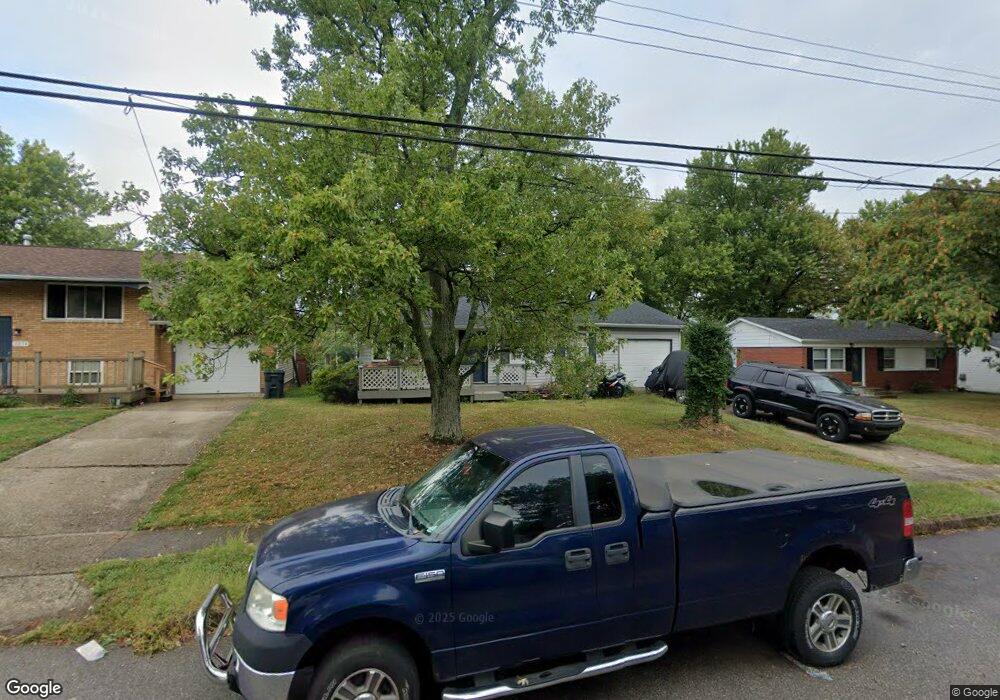
3372 Fir Tree Ln Erlanger, KY 41018
Estimated Value: $218,000 - $234,412
3
Beds
2
Baths
936
Sq Ft
$244/Sq Ft
Est. Value
About This Home
This home is located at 3372 Fir Tree Ln, Erlanger, KY 41018 and is currently estimated at $228,103, approximately $243 per square foot. 3372 Fir Tree Ln is a home located in Boone County with nearby schools including Florence Elementary School, Jones Middle School, and Boone County High School.
Ownership History
Date
Name
Owned For
Owner Type
Purchase Details
Closed on
Jun 30, 2020
Sold by
Dillinger Spencer Reed and Dillinger Marisa
Bought by
Colton S Estate Llc
Current Estimated Value
Purchase Details
Closed on
Feb 28, 2020
Sold by
Sj Property Management Llc
Bought by
Dillinger Spencer Reed and Dillinger Marisa
Home Financials for this Owner
Home Financials are based on the most recent Mortgage that was taken out on this home.
Original Mortgage
$116,000
Outstanding Balance
$102,491
Interest Rate
3.6%
Mortgage Type
New Conventional
Estimated Equity
$125,612
Purchase Details
Closed on
Nov 21, 2000
Sold by
Pittman Danny D
Bought by
Smith Daniel G
Home Financials for this Owner
Home Financials are based on the most recent Mortgage that was taken out on this home.
Original Mortgage
$98,900
Interest Rate
7.83%
Mortgage Type
VA
Create a Home Valuation Report for This Property
The Home Valuation Report is an in-depth analysis detailing your home's value as well as a comparison with similar homes in the area
Home Values in the Area
Average Home Value in this Area
Purchase History
| Date | Buyer | Sale Price | Title Company |
|---|---|---|---|
| Colton S Estate Llc | -- | None Available | |
| Dillinger Spencer Reed | $145,000 | None Available | |
| Smith Daniel G | $97,000 | -- |
Source: Public Records
Mortgage History
| Date | Status | Borrower | Loan Amount |
|---|---|---|---|
| Open | Dillinger Spencer Reed | $116,000 | |
| Previous Owner | Smith Daniel G | $98,900 |
Source: Public Records
Tax History Compared to Growth
Tax History
| Year | Tax Paid | Tax Assessment Tax Assessment Total Assessment is a certain percentage of the fair market value that is determined by local assessors to be the total taxable value of land and additions on the property. | Land | Improvement |
|---|---|---|---|---|
| 2025 | $1,703 | $145,000 | $20,000 | $125,000 |
| 2024 | $1,675 | $145,000 | $20,000 | $125,000 |
| 2023 | $1,657 | $145,000 | $20,000 | $125,000 |
| 2022 | $1,664 | $145,000 | $20,000 | $125,000 |
| 2021 | $1,743 | $145,000 | $20,000 | $125,000 |
| 2020 | $1,696 | $145,000 | $15,000 | $130,000 |
| 2019 | $1,435 | $124,400 | $15,000 | $109,400 |
| 2018 | $1,488 | $124,400 | $15,000 | $109,400 |
| 2017 | $1,174 | $102,680 | $15,000 | $87,680 |
| 2015 | $1,165 | $102,680 | $15,000 | $87,680 |
| 2013 | -- | $102,680 | $15,000 | $87,680 |
Source: Public Records
Map
Nearby Homes
- 3375 Fir Tree Ln
- 3395 Cedar Tree Ln
- 3213 Riggs Ave
- 3815 Hope Ln
- 437 Center St
- 419 Locust St
- 3169 Birch Dr
- 3915 Rankin Dr
- 403 Locust St
- 2474 Sierra Dr
- Carrington Plan at Reserve at Meadowood - Designer Collection
- Mitchell Plan at Sanctuary Village - Masterpiece Collection
- Clay Plan at Sanctuary Village - Masterpiece Collection
- Leland Plan at Sanctuary Village - Masterpiece Collection
- Paxton Plan at Sanctuary Village - Masterpiece Collection
- Blair Plan at Reserve at Meadowood - Designer Collection
- Finley Plan at Sanctuary Village - Masterpiece Collection
- Grandin Plan at Reserve at Meadowood - Designer Collection
- Calvin Plan at Reserve at Meadowood - Designer Collection
- Rhodes Plan at Sanctuary Village - Masterpiece Collection
- 3374 Fir Tree Ln
- 3370 Fir Tree Ln
- 3376 Fir Tree Ln
- 3368 Fir Tree Ln
- 3375 Tulip Tree Dr
- 3377 Tulip Tree Dr
- 3373 Tulip Tree Dr
- 3373 Tulip Tree Ln
- 3379 Tulip Tree Dr
- 3371 Tulip Tree Dr
- 3373 Fir Tree Ln
- 3378 Fir Tree Ln
- 3366 Fir Tree Ln
- 3377 Fir Tree Ln
- 3377 Fir Tree Ln
- 3381 Tulip Tree Dr
- 3369 Tulip Tree Dr
- 3369 Fir Tree Ln
- 3379 Fir Tree Ln
- 3364 Fir Tree Ln