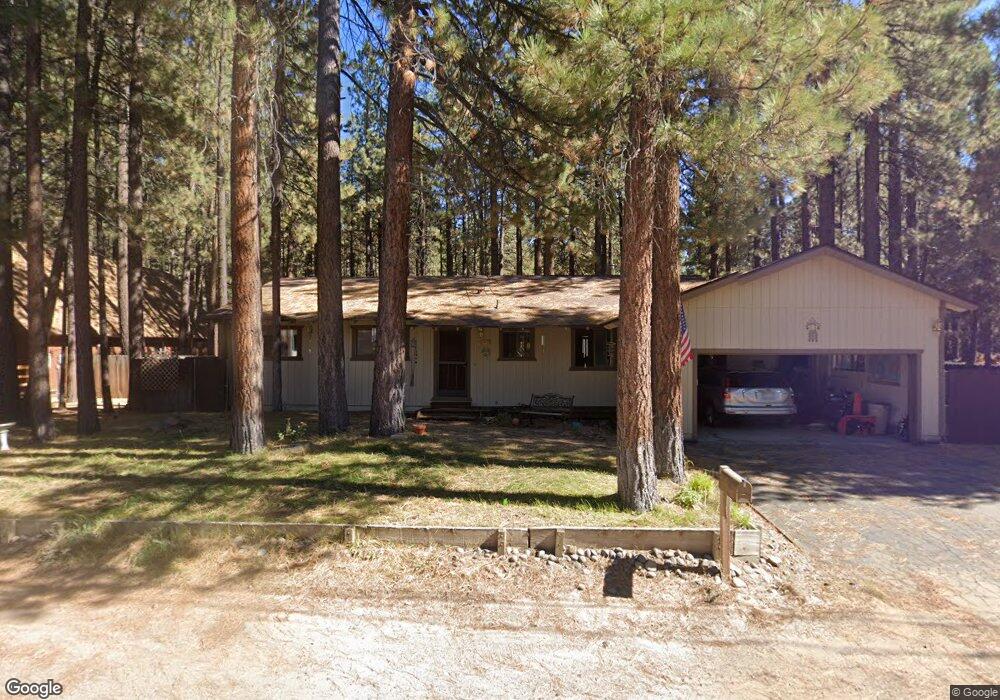
3372 Hobart Rd South Lake Tahoe, CA 96150
Estimated Value: $608,000 - $654,000
3
Beds
2
Baths
1,456
Sq Ft
$437/Sq Ft
Est. Value
About This Home
This home is located at 3372 Hobart Rd, South Lake Tahoe, CA 96150 and is currently estimated at $636,216, approximately $436 per square foot. 3372 Hobart Rd is a home located in El Dorado County with nearby schools including Bijou Community, South Tahoe Middle School, and South Tahoe High School.
Ownership History
Date
Name
Owned For
Owner Type
Purchase Details
Closed on
Nov 22, 2004
Sold by
Brindisi Joan
Bought by
Joan Brindisi Revocable Living Trust
Current Estimated Value
Purchase Details
Closed on
Jun 4, 2002
Sold by
Ditter Michelle K and Bestor Pamela J
Bought by
Brindisi Joan and Brindisi Vita
Home Financials for this Owner
Home Financials are based on the most recent Mortgage that was taken out on this home.
Original Mortgage
$100,000
Outstanding Balance
$42,342
Interest Rate
6.83%
Estimated Equity
$593,874
Purchase Details
Closed on
Mar 29, 1996
Sold by
Thompson Michael D and Thompson Elisabeth Anne
Bought by
Ditter Michelle K and Bestor Pamela J
Home Financials for this Owner
Home Financials are based on the most recent Mortgage that was taken out on this home.
Original Mortgage
$140,900
Interest Rate
7.41%
Mortgage Type
FHA
Purchase Details
Closed on
Sep 8, 1995
Sold by
Thompson Michael D
Bought by
Thompson Michael D and Thompson Elisabeth Anne
Create a Home Valuation Report for This Property
The Home Valuation Report is an in-depth analysis detailing your home's value as well as a comparison with similar homes in the area
Home Values in the Area
Average Home Value in this Area
Purchase History
| Date | Buyer | Sale Price | Title Company |
|---|---|---|---|
| Joan Brindisi Revocable Living Trust | -- | -- | |
| Vita J Brindisi Revocable Living Trust | -- | -- | |
| Brindisi Joan | $289,000 | Fidelity National Title Co | |
| Ditter Michelle K | $144,500 | First American Title Co | |
| Thompson Michael D | -- | -- |
Source: Public Records
Mortgage History
| Date | Status | Borrower | Loan Amount |
|---|---|---|---|
| Open | Brindisi Joan | $100,000 | |
| Previous Owner | Ditter Michelle K | $140,900 |
Source: Public Records
Tax History Compared to Growth
Tax History
| Year | Tax Paid | Tax Assessment Tax Assessment Total Assessment is a certain percentage of the fair market value that is determined by local assessors to be the total taxable value of land and additions on the property. | Land | Improvement |
|---|---|---|---|---|
| 2025 | $4,528 | $426,909 | $103,396 | $323,513 |
| 2024 | $4,528 | $418,539 | $101,369 | $317,170 |
| 2023 | $4,449 | $410,333 | $99,382 | $310,951 |
| 2022 | $4,406 | $402,288 | $97,434 | $304,854 |
| 2021 | $4,338 | $394,401 | $95,524 | $298,877 |
| 2020 | $4,275 | $390,358 | $94,545 | $295,813 |
| 2019 | $4,254 | $382,705 | $92,692 | $290,013 |
| 2018 | $4,160 | $375,202 | $90,875 | $284,327 |
| 2017 | $4,095 | $367,846 | $89,094 | $278,752 |
| 2016 | $4,012 | $360,635 | $87,348 | $273,287 |
| 2015 | $3,096 | $322,500 | $78,000 | $244,500 |
| 2014 | $3,096 | $281,500 | $68,000 | $213,500 |
Source: Public Records
Map
Nearby Homes
- 1351 Gilmore Lake Rd
- 1351 Susie Lake Rd
- 1304 Susie Lake Rd
- 3510 Rancho Cir
- 1442 Price Rd
- 3740 Blackwood Rd Unit 42
- 3740 Blackwood Rd Unit 55
- 3740 Blackwood Rd Unit 61
- 3740 Blackwood Rd Unit 32
- 1309 Peninsula Rd
- 3511 Bode Dr
- 1291 Peninsula Rd
- 1201 Glenwood Way
- 3567 Saddle Rd
- 1410 Ski Run Blvd Unit 28
- 1410 Ski Run Blvd Unit 16
- 3546 Spruce Ave
- 3715 Blackwood Rd
- 1412 Ski Run Blvd
- 1387 Matheson Dr
- 3380 Hobart Rd
- 3373 Aloha Rd
- 3358 Hobart Rd
- 3386 Hobart Rd
- 3375 Hobart Rd
- 3371 Hobart Rd
- 3376 Woodland Rd
- 3364 Woodland Rd
- 3387 Aloha Rd
- 3354 Hobart Rd
- 3392 Hobart Rd
- 3356 Woodland Rd
- 3384 Woodland Rd
- 3393 Aloha Rd
- 3350 Woodland Rd
- 3390 Woodland Rd
- 3346 Hobart Rd
- 3399 Aloha Rd
- 1370 Gilmore Lake Rd
- 3344 Woodland Rd