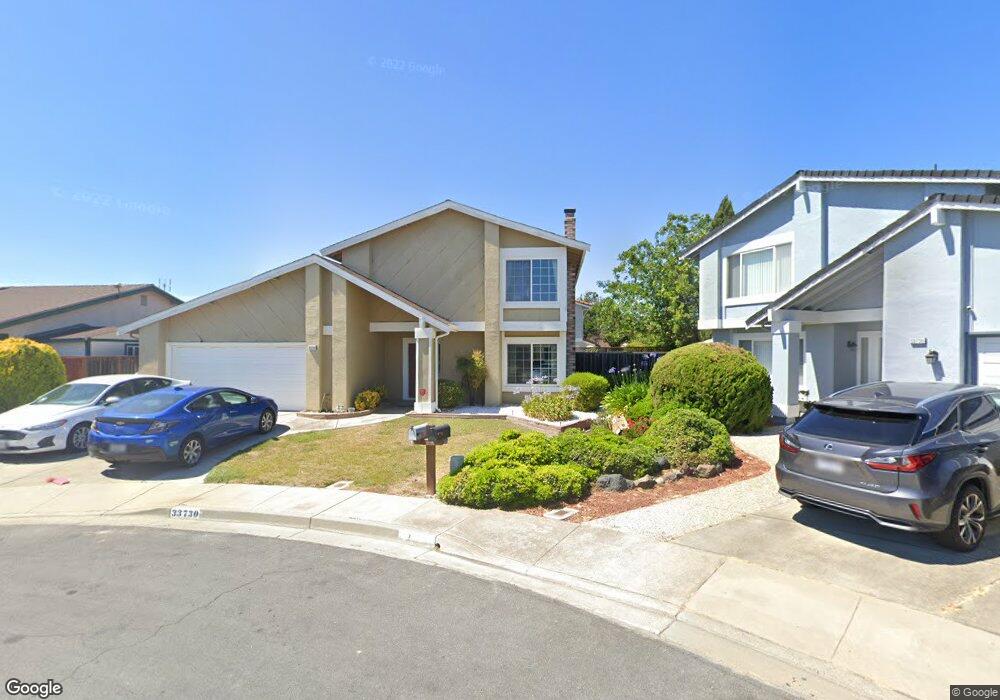
33730 Pistol Ct Fremont, CA 94555
Ardenwood NeighborhoodEstimated Value: $1,685,000 - $2,040,000
4
Beds
3
Baths
2,052
Sq Ft
$909/Sq Ft
Est. Value
About This Home
This home is located at 33730 Pistol Ct, Fremont, CA 94555 and is currently estimated at $1,865,680, approximately $909 per square foot. 33730 Pistol Ct is a home located in Alameda County with nearby schools including Ardenwood Elementary, Thornton Middle School, and American High School.
Ownership History
Date
Name
Owned For
Owner Type
Purchase Details
Closed on
Nov 14, 2012
Sold by
Sharma Girishkumar R and Sharma Nidhi
Bought by
Sharma Girishkumar and Sharma Nidhi
Current Estimated Value
Purchase Details
Closed on
Aug 16, 2002
Sold by
Lam Wilson and Lam Cynthia K
Bought by
Sharma Girishkumar R and Sharma Nidhi
Home Financials for this Owner
Home Financials are based on the most recent Mortgage that was taken out on this home.
Original Mortgage
$444,000
Outstanding Balance
$186,265
Interest Rate
6.43%
Estimated Equity
$1,679,415
Purchase Details
Closed on
Oct 5, 1995
Sold by
Cox Steven M and Cox Lydia M
Bought by
Lam Wilson and Lam Cynthia K
Home Financials for this Owner
Home Financials are based on the most recent Mortgage that was taken out on this home.
Original Mortgage
$203,150
Interest Rate
7.8%
Create a Home Valuation Report for This Property
The Home Valuation Report is an in-depth analysis detailing your home's value as well as a comparison with similar homes in the area
Home Values in the Area
Average Home Value in this Area
Purchase History
| Date | Buyer | Sale Price | Title Company |
|---|---|---|---|
| Sharma Girishkumar | -- | None Available | |
| Sharma Girishkumar R | $555,000 | American Title Co | |
| Lam Wilson | $270,500 | Northwestern Title Company |
Source: Public Records
Mortgage History
| Date | Status | Borrower | Loan Amount |
|---|---|---|---|
| Open | Sharma Girishkumar R | $444,000 | |
| Previous Owner | Lam Wilson | $203,150 |
Source: Public Records
Tax History Compared to Growth
Tax History
| Year | Tax Paid | Tax Assessment Tax Assessment Total Assessment is a certain percentage of the fair market value that is determined by local assessors to be the total taxable value of land and additions on the property. | Land | Improvement |
|---|---|---|---|---|
| 2025 | $9,668 | $796,750 | $241,125 | $562,625 |
| 2024 | $9,668 | $780,994 | $236,398 | $551,596 |
| 2023 | $9,407 | $772,548 | $231,764 | $540,784 |
| 2022 | $9,283 | $750,402 | $227,220 | $530,182 |
| 2021 | $9,055 | $735,556 | $222,767 | $519,789 |
| 2020 | $9,075 | $734,947 | $220,484 | $514,463 |
| 2019 | $8,970 | $720,538 | $216,161 | $504,377 |
| 2018 | $8,795 | $706,414 | $211,924 | $494,490 |
| 2017 | $8,574 | $692,567 | $207,770 | $484,797 |
| 2016 | $8,427 | $678,991 | $203,697 | $475,294 |
| 2015 | $8,314 | $668,797 | $200,639 | $468,158 |
| 2014 | $8,170 | $655,698 | $196,709 | $458,989 |
Source: Public Records
Map
Nearby Homes
- 4512 Macbeth Ave
- 4744 Touchstone Terrace
- 34102 Zaner Way
- 33018 Soquel St
- 32945 Regents Blvd
- 5301 Shamrock Common
- 4141 Deep Creek Rd Unit 137
- 4243 Nerissa Cir
- 34198 Tony Terrace
- 4272 Warbler Loop
- 33064 Compton Ct
- 34648 Musk Terrace
- 34565 Pueblo Terrace
- 5220 Fairbanks Common
- 5621 Via Lugano
- 34192 Firenze Terrace
- 4532 Delores Dr
- 34607 Pueblo Terrace
- 34627 Pueblo Terrace
- 5308 Tacoma Common
- 33724 Pistol Ct
- 33736 Pistol Ct
- 33709 Simple Ct
- 33703 Simple Ct
- 33718 Pistol Ct
- 33715 Slender Ct
- 33742 Pistol Ct
- 33766 Shallow Ct
- 33697 Simple Ct
- 33712 Pistol Ct
- 33725 Pistol Ct
- 33731 Pistol Ct
- 33721 Slender Ct
- 33737 Pistol Ct
- 33691 Simple Ct
- 33719 Pistol Ct
- 33772 Shallow Ct
- 33706 Pistol Ct
- 33713 Pistol Ct
- 33727 Slender Ct