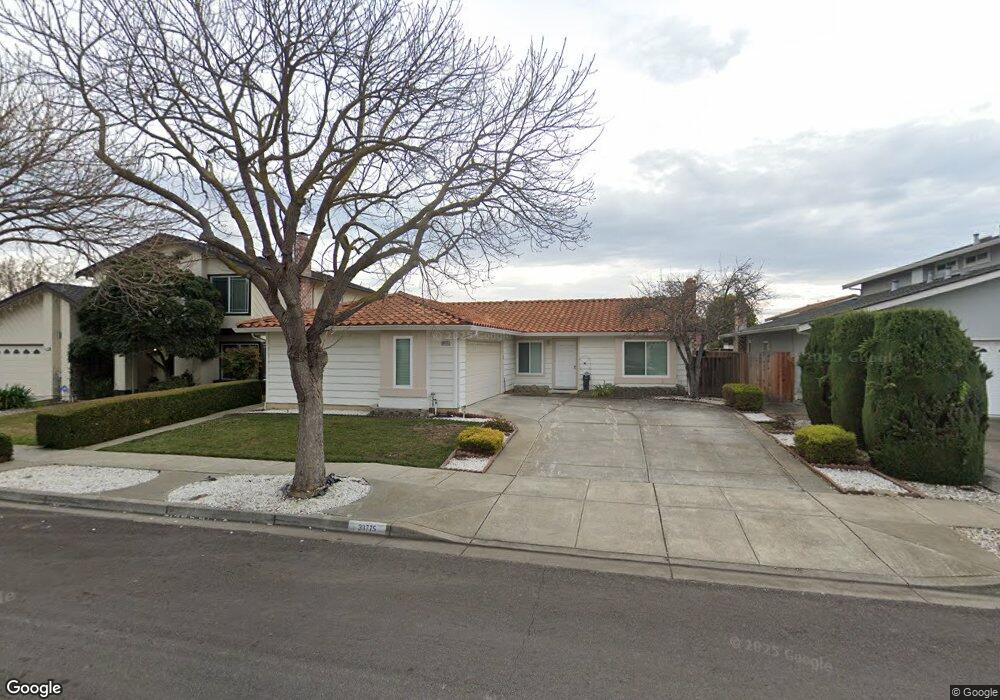
33775 Shallow Ct Fremont, CA 94555
Ardenwood NeighborhoodEstimated Value: $1,545,006 - $1,754,000
4
Beds
2
Baths
1,498
Sq Ft
$1,107/Sq Ft
Est. Value
About This Home
This home is located at 33775 Shallow Ct, Fremont, CA 94555 and is currently estimated at $1,658,252, approximately $1,106 per square foot. 33775 Shallow Ct is a home located in Alameda County with nearby schools including Ardenwood Elementary, Thornton Middle School, and American High School.
Ownership History
Date
Name
Owned For
Owner Type
Purchase Details
Closed on
Nov 24, 2004
Sold by
Ramasamy Govindaperumal and Perumal Aruna
Bought by
Srinivasan Gopal and Gopi Jainthi
Current Estimated Value
Home Financials for this Owner
Home Financials are based on the most recent Mortgage that was taken out on this home.
Original Mortgage
$520,000
Outstanding Balance
$247,673
Interest Rate
5%
Mortgage Type
Purchase Money Mortgage
Estimated Equity
$1,410,579
Purchase Details
Closed on
Jan 26, 2000
Sold by
Lewis Timothy A and Lewis Helen T
Bought by
Ramasamy Govindaperumal and Perumal Aruna
Home Financials for this Owner
Home Financials are based on the most recent Mortgage that was taken out on this home.
Original Mortgage
$280,000
Interest Rate
7.5%
Purchase Details
Closed on
May 28, 1996
Sold by
Chen Hui Li
Bought by
Lewis Timothy A and Lewis Helen T
Home Financials for this Owner
Home Financials are based on the most recent Mortgage that was taken out on this home.
Original Mortgage
$205,200
Interest Rate
7.97%
Create a Home Valuation Report for This Property
The Home Valuation Report is an in-depth analysis detailing your home's value as well as a comparison with similar homes in the area
Home Values in the Area
Average Home Value in this Area
Purchase History
| Date | Buyer | Sale Price | Title Company |
|---|---|---|---|
| Srinivasan Gopal | $650,000 | First American Title Co | |
| Ramasamy Govindaperumal | $350,000 | Fidelity National Title | |
| Lewis Timothy A | $228,000 | Chicago Title Co |
Source: Public Records
Mortgage History
| Date | Status | Borrower | Loan Amount |
|---|---|---|---|
| Open | Srinivasan Gopal | $520,000 | |
| Previous Owner | Ramasamy Govindaperumal | $280,000 | |
| Previous Owner | Lewis Timothy A | $205,200 | |
| Closed | Ramasamy Govindaperumal | $35,000 | |
| Closed | Srinivasan Gopal | $65,000 |
Source: Public Records
Tax History
| Year | Tax Paid | Tax Assessment Tax Assessment Total Assessment is a certain percentage of the fair market value that is determined by local assessors to be the total taxable value of land and additions on the property. | Land | Improvement |
|---|---|---|---|---|
| 2025 | $10,803 | $898,956 | $271,787 | $634,169 |
| 2024 | $10,803 | $881,198 | $266,459 | $621,739 |
| 2023 | $10,514 | $870,784 | $261,235 | $609,549 |
| 2022 | $10,380 | $846,715 | $256,114 | $597,601 |
| 2021 | $10,124 | $829,978 | $251,093 | $585,885 |
| 2020 | $10,159 | $828,398 | $248,519 | $579,879 |
| 2019 | $10,042 | $812,161 | $243,648 | $568,513 |
| 2018 | $9,846 | $796,243 | $238,873 | $557,370 |
| 2017 | $9,599 | $780,636 | $234,191 | $546,445 |
| 2016 | $9,437 | $765,335 | $229,600 | $535,735 |
| 2015 | $9,312 | $753,843 | $226,153 | $527,690 |
| 2014 | $9,152 | $739,081 | $221,724 | $517,357 |
Source: Public Records
Map
Nearby Homes
- 4940 Bunkhouse St
- 33038 Garfinkle St
- 34203 Petard Terrace
- 34184 Duke Ln
- 4819 Kenwood St
- 4141 Deep Creek Rd Unit 89
- 4141 Deep Creek Rd Unit 106
- 4141 Deep Creek Rd Unit 84
- 4900 Creekwood Dr
- 5358 Matthew Terrace
- 5410 Buckner Terrace
- 4822 La Habra St
- 4691 Rousillon Ave
- 4235 Tanager Common
- 4229 Tanager Common
- 34671 Agree Terrace
- 3868 Fiano Common
- 4409 Darwin Dr
- 5220 Fairbanks Common
- 34362 Enea Terrace Unit 2
- 33771 Shallow Ct
- 33779 Shallow Ct
- 33473 Bardolph Cir
- 33467 Bardolph Cir
- 33479 Bardolph Cir
- 33765 Shallow Ct
- 33461 Bardolph Cir
- 33776 Shallow Ct
- 33772 Shallow Ct
- 33780 Shallow Ct
- 33485 Bardolph Cir
- 33784 Shallow Ct
- 33766 Shallow Ct
- 33491 Bardolph Cir
- 33788 Shallow Ct
- 33742 Pistol Ct
- 33737 Pistol Ct
- 33727 Slender Ct
- 33466 Bardolph Cir
- 33733 Slender Ct
Your Personal Tour Guide
Ask me questions while you tour the home.