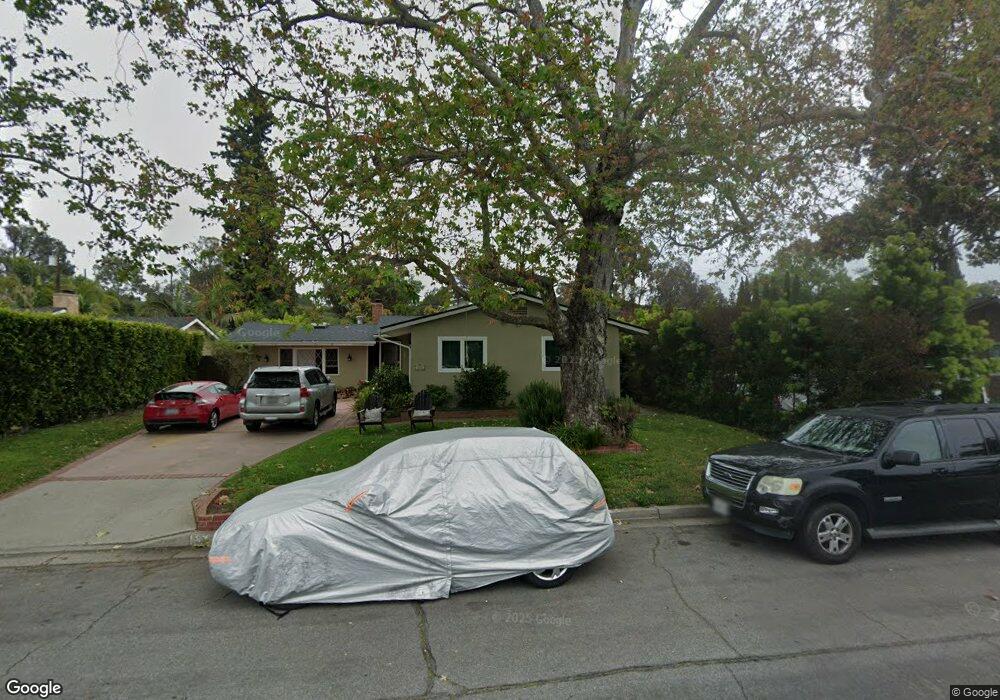
338 Apple Grove Ln Santa Barbara, CA 93105
Hitchcock NeighborhoodEstimated Value: $1,847,000 - $2,284,621
5
Beds
4
Baths
2,357
Sq Ft
$868/Sq Ft
Est. Value
About This Home
This home is located at 338 Apple Grove Ln, Santa Barbara, CA 93105 and is currently estimated at $2,046,655, approximately $868 per square foot. 338 Apple Grove Ln is a home located in Santa Barbara County with nearby schools including Vieja Valley Elementary School, La Colina Junior High School, and San Marcos Senior High School.
Ownership History
Date
Name
Owned For
Owner Type
Purchase Details
Closed on
Dec 12, 2023
Sold by
Mkpado Family Trust
Bought by
Christopher Mkpado Survivors Trust and Mkpado
Current Estimated Value
Purchase Details
Closed on
May 31, 2006
Sold by
Mkpado Christopher and Mkpado Sharol
Bought by
Mkpado Christopher and Mkpado Sharol
Purchase Details
Closed on
Mar 2, 2005
Sold by
Mulder Ronald and Mulder Rebekah
Bought by
Mkpado Christopher and Mkpado Sharol
Home Financials for this Owner
Home Financials are based on the most recent Mortgage that was taken out on this home.
Original Mortgage
$650,000
Interest Rate
4.57%
Mortgage Type
Negative Amortization
Purchase Details
Closed on
May 13, 1998
Sold by
Mkpado Christopher
Bought by
Mkpado Sharol
Purchase Details
Closed on
Apr 22, 1998
Sold by
Huckeba Charles M and Jill Cole P
Bought by
Mulder Ronald and Mulder Rebekah
Create a Home Valuation Report for This Property
The Home Valuation Report is an in-depth analysis detailing your home's value as well as a comparison with similar homes in the area
Home Values in the Area
Average Home Value in this Area
Purchase History
| Date | Buyer | Sale Price | Title Company |
|---|---|---|---|
| Christopher Mkpado Survivors Trust | -- | None Listed On Document | |
| Mkpado Christopher | -- | None Available | |
| Mkpado Christopher | -- | Fidelity National Title Co | |
| Mkpado Sharol | -- | Equity Title Company | |
| Mulder Ronald | -- | Equity Title Company |
Source: Public Records
Mortgage History
| Date | Status | Borrower | Loan Amount |
|---|---|---|---|
| Previous Owner | Mkpado Christopher | $650,000 |
Source: Public Records
Tax History Compared to Growth
Tax History
| Year | Tax Paid | Tax Assessment Tax Assessment Total Assessment is a certain percentage of the fair market value that is determined by local assessors to be the total taxable value of land and additions on the property. | Land | Improvement |
|---|---|---|---|---|
| 2025 | $5,943 | $555,359 | $223,534 | $331,825 |
| 2023 | $5,943 | $533,795 | $214,854 | $318,941 |
| 2022 | $5,735 | $523,330 | $210,642 | $312,688 |
| 2021 | $5,530 | $513,069 | $206,512 | $306,557 |
| 2020 | $5,471 | $507,809 | $204,395 | $303,414 |
| 2019 | $5,311 | $497,853 | $200,388 | $297,465 |
| 2018 | $5,208 | $488,092 | $196,459 | $291,633 |
| 2017 | $5,043 | $478,522 | $192,607 | $285,915 |
| 2016 | $4,951 | $469,140 | $188,831 | $280,309 |
| 2015 | $4,899 | $462,094 | $185,995 | $276,099 |
| 2014 | -- | $453,043 | $182,352 | $270,691 |
Source: Public Records
Map
Nearby Homes
- 3645 San Jose Ln
- 3708 Greggory Way Unit 1
- 155 S Ontare Rd
- 37 La Cumbre Cir
- 634 Calle de Los Amigos
- 3718 State St Unit 316
- 3718 State St Unit 314
- 3566 Modoc Rd Unit 33
- 3726 State St Unit 203
- 3728 State St Unit 135
- 3726 State St Unit 204
- 3919 Via Laguna
- 2720 Clinton Terrace
- 832 Vincente Way
- 3735 San Remo Dr
- 3737 San Remo Dr
- 734 Calle de Los Amigos
- 3520 La Entrada
- 3706 Avon Ln
- 3676 Eileen Way
- 326 Apple Grove Ln
- 350 Apple Grove Ln
- 338 Apple Grove
- 314 Apple Grove Ln
- 364 Apple Grove Ln
- 328 Stevens Rd
- 340 Stevens Rd
- 316 Stevens Rd
- 333 Apple Grove Ln
- 358 Stevens Rd
- 306 Apple Grove Ln
- 349 Applegrove Ln
- 325 Apple Grove Ln
- 349 Apple Grove Ln
- 372 Apple Grove Ln
- 310 Stevens Rd
- 361 Apple Grove Ln
- 311 Apple Grove Ln
- 378 Stevens Rd
- 290 Apple Grove Ln