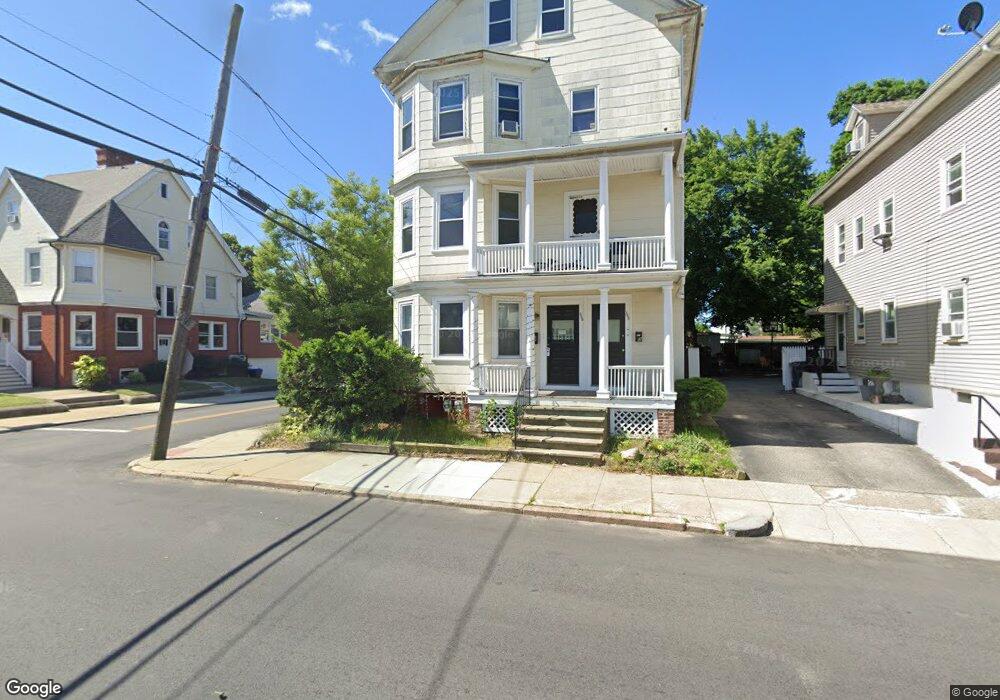
338 Branch Ave Providence, RI 02904
Charles NeighborhoodEstimated Value: $675,000 - $695,000
9
Beds
3
Baths
3,906
Sq Ft
$175/Sq Ft
Est. Value
About This Home
This home is located at 338 Branch Ave, Providence, RI 02904 and is currently estimated at $685,000, approximately $175 per square foot. 338 Branch Ave is a home located in Providence County with nearby schools including Times Squared Academy, Times2 Elementary School, and Times2 Middle/High School.
Ownership History
Date
Name
Owned For
Owner Type
Purchase Details
Closed on
Nov 15, 2018
Sold by
A R & A B Palumbo Lt and Palumbo
Bought by
Palumbo Ft and Palumbo
Current Estimated Value
Purchase Details
Closed on
Apr 8, 2015
Sold by
Palumbo Anthony and Palumbo June
Bought by
Palumbo June B
Purchase Details
Closed on
Aug 18, 2000
Sold by
Palumbo Anthony R and Palumbo June B
Bought by
Housing Dev Corp End
Create a Home Valuation Report for This Property
The Home Valuation Report is an in-depth analysis detailing your home's value as well as a comparison with similar homes in the area
Home Values in the Area
Average Home Value in this Area
Purchase History
| Date | Buyer | Sale Price | Title Company |
|---|---|---|---|
| Palumbo Ft | -- | -- | |
| Palumbo June B | -- | -- | |
| Housing Dev Corp End | $42,000 | -- |
Source: Public Records
Tax History
| Year | Tax Paid | Tax Assessment Tax Assessment Total Assessment is a certain percentage of the fair market value that is determined by local assessors to be the total taxable value of land and additions on the property. | Land | Improvement |
|---|---|---|---|---|
| 2025 | $7,538 | $538,400 | $128,000 | $410,400 |
| 2024 | $6,226 | $339,300 | $68,000 | $271,300 |
| 2023 | $6,226 | $339,300 | $68,000 | $271,300 |
| 2022 | $6,040 | $339,300 | $68,000 | $271,300 |
| 2021 | $5,381 | $219,100 | $61,000 | $158,100 |
| 2020 | $5,381 | $219,100 | $61,000 | $158,100 |
| 2019 | $5,381 | $219,100 | $61,000 | $158,100 |
| 2018 | $3,631 | $113,600 | $47,100 | $66,500 |
| 2017 | $3,631 | $113,600 | $47,100 | $66,500 |
| 2016 | $3,631 | $113,600 | $47,100 | $66,500 |
| 2015 | $3,353 | $101,300 | $49,900 | $51,400 |
| 2014 | $3,419 | $101,300 | $49,900 | $51,400 |
| 2013 | $3,419 | $101,300 | $49,900 | $51,400 |
Source: Public Records
Map
Nearby Homes
Your Personal Tour Guide
Ask me questions while you tour the home.