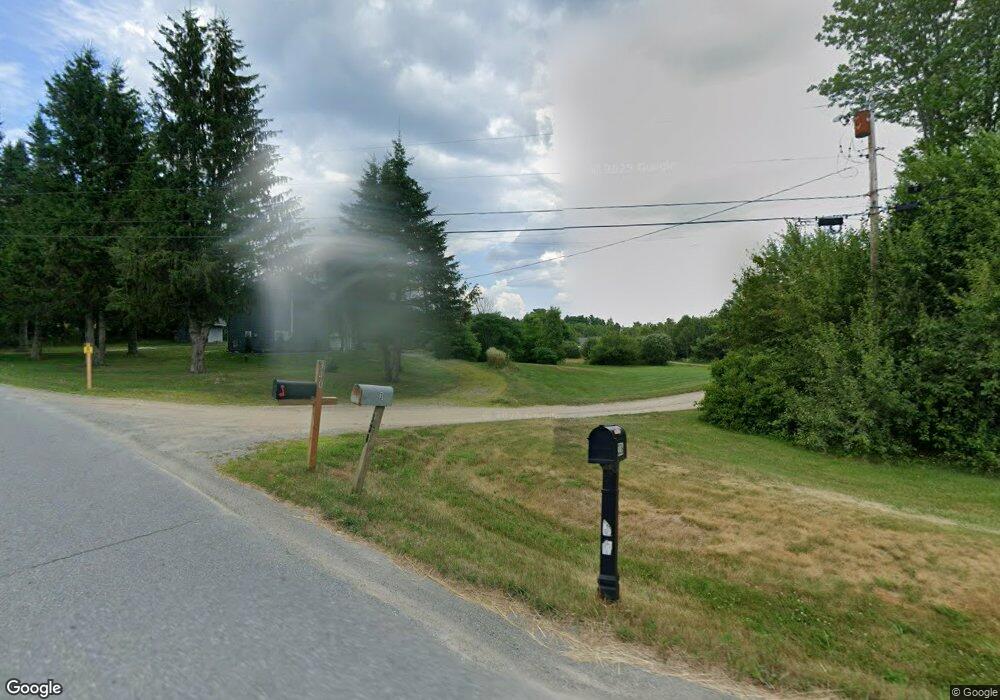
338 Chapman Rd Newburgh, ME 04444
Estimated Value: $215,391 - $335,000
--
Bed
--
Bath
284
Sq Ft
$950/Sq Ft
Est. Value
About This Home
This home is located at 338 Chapman Rd, Newburgh, ME 04444 and is currently estimated at $269,797, approximately $949 per square foot. 338 Chapman Rd is a home.
Ownership History
Date
Name
Owned For
Owner Type
Purchase Details
Closed on
Jun 25, 2021
Sold by
Lindsey Amy D
Bought by
Lindsey Kaitlyn S
Current Estimated Value
Home Financials for this Owner
Home Financials are based on the most recent Mortgage that was taken out on this home.
Original Mortgage
$75,252
Outstanding Balance
$68,280
Interest Rate
2.9%
Mortgage Type
Purchase Money Mortgage
Estimated Equity
$201,517
Purchase Details
Closed on
Jun 2, 2015
Sold by
Turner Anne B
Bought by
Lindsey Amy D
Home Financials for this Owner
Home Financials are based on the most recent Mortgage that was taken out on this home.
Original Mortgage
$75,000
Interest Rate
3.65%
Mortgage Type
Commercial
Purchase Details
Closed on
Jul 14, 2006
Sold by
Anderson Randolph W
Bought by
Lindsey Amy D and Turner Anne B
Home Financials for this Owner
Home Financials are based on the most recent Mortgage that was taken out on this home.
Original Mortgage
$80,000
Interest Rate
6.71%
Mortgage Type
Commercial
Create a Home Valuation Report for This Property
The Home Valuation Report is an in-depth analysis detailing your home's value as well as a comparison with similar homes in the area
Home Values in the Area
Average Home Value in this Area
Purchase History
| Date | Buyer | Sale Price | Title Company |
|---|---|---|---|
| Lindsey Kaitlyn S | -- | None Available | |
| Lindsey Amy D | -- | -- | |
| Lindsey Amy D | -- | -- |
Source: Public Records
Mortgage History
| Date | Status | Borrower | Loan Amount |
|---|---|---|---|
| Open | Lindsey Kaitlyn S | $75,252 | |
| Previous Owner | Lindsey Amy D | $75,000 | |
| Previous Owner | Lindsey Amy D | $80,000 |
Source: Public Records
Tax History Compared to Growth
Tax History
| Year | Tax Paid | Tax Assessment Tax Assessment Total Assessment is a certain percentage of the fair market value that is determined by local assessors to be the total taxable value of land and additions on the property. | Land | Improvement |
|---|---|---|---|---|
| 2024 | $2,158 | $158,688 | $54,733 | $103,955 |
| 2023 | $1,856 | $143,851 | $49,622 | $94,229 |
| 2022 | $1,728 | $112,948 | $39,095 | $73,853 |
| 2021 | $1,718 | $108,047 | $36,087 | $71,960 |
| 2020 | $1,667 | $99,848 | $33,081 | $66,767 |
| 2019 | $1,598 | $90,770 | $30,073 | $60,697 |
| 2018 | $1,543 | $90,770 | $30,073 | $60,697 |
| 2017 | $1,437 | $91,502 | $30,073 | $61,429 |
| 2016 | $1,418 | $91,502 | $30,073 | $61,429 |
| 2015 | $2,013 | $91,502 | $30,073 | $61,429 |
| 2014 | $1,380 | $96,500 | $29,900 | $66,600 |
| 2013 | -- | $96,500 | $29,900 | $66,600 |
Source: Public Records
Map
Nearby Homes
- 2490 Western Ave
- 00 Babcock Rd
- 130 Kennard Rd
- Lot 1 Dalton's Way
- Lot 2 Dalton's Way
- Lot 1-7 Dalton's Way
- Lot #057 Kennebec Rd
- Lot 3 Dalton's Way
- Lot 4 Dalton's Way
- 99 Tapley Farm Rd
- Lot 5 Dalton's Way
- 2206 Carmel Rd N
- Lot 6 Dalton's Way
- Lot 7 Dalton's Way
- 165 Red School House Rd
- 200 Littlefield Rd
- 1249 Kennebec Rd
- 2636 Kennebec Rd
- Lot 65 Freedom Ave
- 105 Carmel Rd S
- 353 Chapman Rd
- 349 Chapman Rd
- 371 Chapman Rd
- 378 Chapman Rd
- 309 Chapman Rd
- 301 Chapman Rd
- 291 Chapman Rd
- 354 Chapman Rd
- 269 Chapman Rd
- 352 Chapman Rd
- 265 Chapman Rd
- 417 Chapman Rd
- 440 Chapman Rd
- 342 Chapman Rd
- 340 Chapman Rd
- 241 Chapman Rd
- Lot 24-1 Chapman Rd
- L 24-1 Chapman Rd
- 2397 Western Ave
- 336 Chapman Rd
