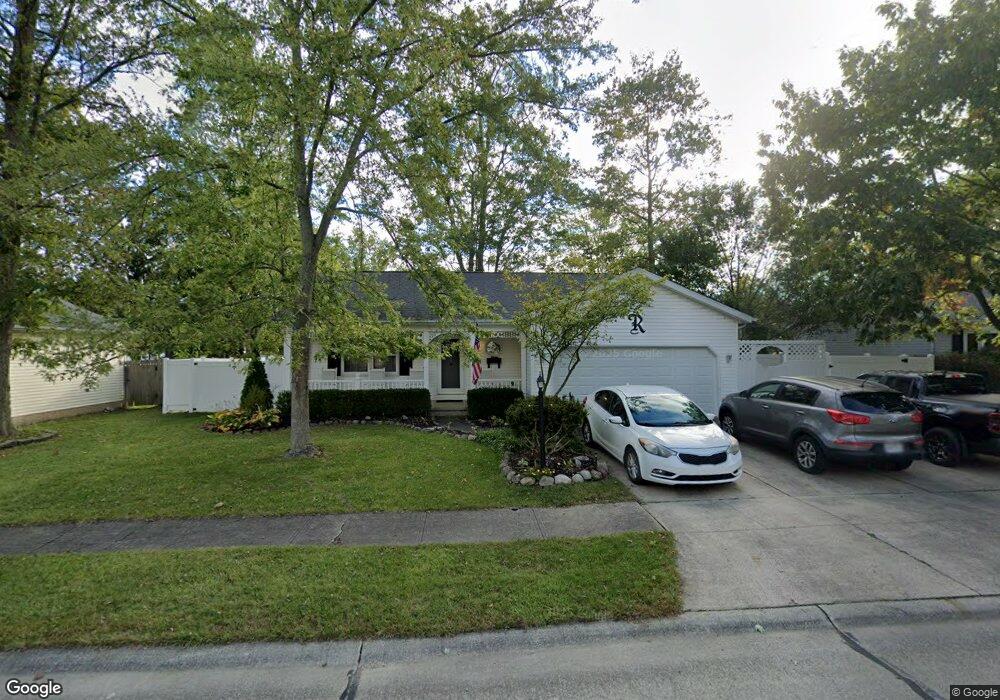
338 Horseshoe Dr Lagrange, OH 44050
Estimated Value: $190,000 - $204,000
2
Beds
1
Bath
1,340
Sq Ft
$147/Sq Ft
Est. Value
About This Home
This home is located at 338 Horseshoe Dr, Lagrange, OH 44050 and is currently estimated at $197,172, approximately $147 per square foot. 338 Horseshoe Dr is a home located in Lorain County with nearby schools including Keystone Elementary School, Keystone Middle School, and Keystone High School.
Ownership History
Date
Name
Owned For
Owner Type
Purchase Details
Closed on
May 7, 2004
Sold by
Simon James Richard
Bought by
Ripley Robert J
Current Estimated Value
Home Financials for this Owner
Home Financials are based on the most recent Mortgage that was taken out on this home.
Original Mortgage
$102,000
Outstanding Balance
$45,695
Interest Rate
4.87%
Mortgage Type
Purchase Money Mortgage
Estimated Equity
$151,477
Purchase Details
Closed on
Jul 1, 1999
Sold by
Hud
Bought by
Simon James Richard
Home Financials for this Owner
Home Financials are based on the most recent Mortgage that was taken out on this home.
Original Mortgage
$90,389
Interest Rate
7.54%
Mortgage Type
FHA
Purchase Details
Closed on
Sep 11, 1998
Sold by
Bower Jeffrey S
Bought by
Hud
Purchase Details
Closed on
Oct 31, 1996
Sold by
Branzski Michael L
Bought by
Bower Jeffery S and Koncar Daphney J
Home Financials for this Owner
Home Financials are based on the most recent Mortgage that was taken out on this home.
Original Mortgage
$103,579
Interest Rate
8.23%
Mortgage Type
FHA
Create a Home Valuation Report for This Property
The Home Valuation Report is an in-depth analysis detailing your home's value as well as a comparison with similar homes in the area
Home Values in the Area
Average Home Value in this Area
Purchase History
| Date | Buyer | Sale Price | Title Company |
|---|---|---|---|
| Ripley Robert J | $127,500 | Sandstone Title Agency Ltd | |
| Simon James Richard | -- | -- | |
| Hud | $92,000 | -- | |
| Bower Jeffery S | $104,000 | -- |
Source: Public Records
Mortgage History
| Date | Status | Borrower | Loan Amount |
|---|---|---|---|
| Open | Ripley Robert J | $102,000 | |
| Previous Owner | Simon James Richard | $90,389 | |
| Previous Owner | Bower Jeffery S | $103,579 | |
| Closed | Ripley Robert J | $12,750 |
Source: Public Records
Tax History Compared to Growth
Tax History
| Year | Tax Paid | Tax Assessment Tax Assessment Total Assessment is a certain percentage of the fair market value that is determined by local assessors to be the total taxable value of land and additions on the property. | Land | Improvement |
|---|---|---|---|---|
| 2024 | $2,905 | $61,849 | $6,689 | $55,160 |
| 2023 | $2,750 | $48,633 | $6,787 | $41,846 |
| 2022 | $2,732 | $48,633 | $6,787 | $41,846 |
| 2021 | $2,731 | $48,633 | $6,787 | $41,846 |
| 2020 | $2,602 | $41,070 | $5,730 | $35,340 |
| 2019 | $2,588 | $41,070 | $5,730 | $35,340 |
| 2018 | $2,102 | $41,070 | $5,730 | $35,340 |
| 2017 | $1,972 | $33,940 | $4,020 | $29,920 |
| 2016 | $1,916 | $33,940 | $4,020 | $29,920 |
| 2015 | $1,912 | $33,940 | $4,020 | $29,920 |
| 2014 | $1,584 | $32,320 | $3,820 | $28,500 |
| 2013 | $1,535 | $32,320 | $3,820 | $28,500 |
Source: Public Records
Map
Nearby Homes
- 364 Hickory Run
- 403 Palomino Ct
- 441 Morgan Ct
- 468 Stallion Ct
- 510 Arabian Ct
- 511 Arabian Ct
- 131 Walleye Ct
- 17225 Fairway Dr
- 19045 Whitehead Rd
- 43311 Peck Wadsworth Rd
- 0 West Rd Unit 5125531
- 21690 State Route 301
- 0 Ohio 301
- 110 - 122 Railroad St
- 110 Railroad St
- 224 W Main St
- 43983 State Route 18
- 194 Railroad St
- 302 N Center St
- 0 Dill Ct Unit 5072837
- 339 Horseshoe Dr
- 337 Horseshoe Dr
- 348 Hickory Run
- 347 Hickory Run
- 349 Hickory Run
- 304 Horseshoe Dr
- 303 Horseshoe Dr
- 305 Horseshoe Dr
- 340 Horseshoe Dr
- 336 Horseshoe Dr
- 350 Hickory Run
- 393 Hickory Run
- 306 Horseshoe Dr
- 335 Horseshoe Dr
- 351 Hickory Run
- 297 Horseshoe Dr
- 298 Horseshoe Dr
- 42444 Webster Rd
- 394 Hickory Run
- 296 Horseshoe Dr