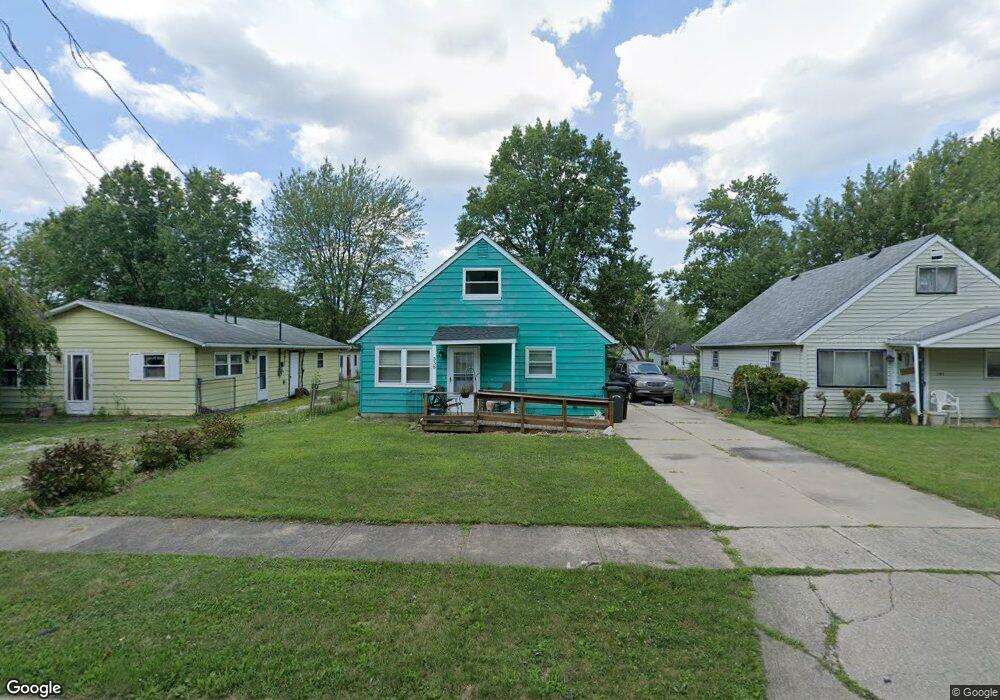
338 Morgan Ave Elyria, OH 44035
Estimated Value: $108,000 - $137,000
2
Beds
1
Bath
800
Sq Ft
$148/Sq Ft
Est. Value
About This Home
This home is located at 338 Morgan Ave, Elyria, OH 44035 and is currently estimated at $118,504, approximately $148 per square foot. 338 Morgan Ave is a home located in Lorain County with nearby schools including Crestwood Elementary School, Westwood Middle School, and Elyria High School.
Ownership History
Date
Name
Owned For
Owner Type
Purchase Details
Closed on
Jul 21, 1998
Sold by
Hud
Bought by
Henderson Annie M and Fluker Marion Oliver
Current Estimated Value
Home Financials for this Owner
Home Financials are based on the most recent Mortgage that was taken out on this home.
Original Mortgage
$28,400
Outstanding Balance
$5,827
Interest Rate
7.03%
Estimated Equity
$112,677
Purchase Details
Closed on
Nov 17, 1995
Sold by
Futrall Douglas
Bought by
West James E
Home Financials for this Owner
Home Financials are based on the most recent Mortgage that was taken out on this home.
Original Mortgage
$48,364
Interest Rate
7.65%
Mortgage Type
FHA
Create a Home Valuation Report for This Property
The Home Valuation Report is an in-depth analysis detailing your home's value as well as a comparison with similar homes in the area
Home Values in the Area
Average Home Value in this Area
Purchase History
| Date | Buyer | Sale Price | Title Company |
|---|---|---|---|
| Henderson Annie M | -- | Gateway Title Agency Inc | |
| West James E | $47,900 | -- |
Source: Public Records
Mortgage History
| Date | Status | Borrower | Loan Amount |
|---|---|---|---|
| Open | Henderson Annie M | $28,400 | |
| Previous Owner | West James E | $48,364 |
Source: Public Records
Tax History
| Year | Tax Paid | Tax Assessment Tax Assessment Total Assessment is a certain percentage of the fair market value that is determined by local assessors to be the total taxable value of land and additions on the property. | Land | Improvement |
|---|---|---|---|---|
| 2024 | $1,235 | $26,089 | $4,480 | $21,609 |
| 2023 | $956 | $17,549 | $3,059 | $14,490 |
| 2022 | $953 | $17,549 | $3,059 | $14,490 |
| 2021 | $955 | $17,549 | $3,059 | $14,490 |
| 2020 | $887 | $14,500 | $2,530 | $11,970 |
| 2019 | $882 | $14,500 | $2,530 | $11,970 |
| 2018 | $883 | $14,500 | $2,530 | $11,970 |
| 2017 | $1,026 | $16,150 | $2,390 | $13,760 |
| 2016 | $1,013 | $16,150 | $2,390 | $13,760 |
| 2015 | $435 | $16,150 | $2,390 | $13,760 |
| 2014 | $429 | $16,150 | $2,390 | $13,760 |
| 2013 | $398 | $15,680 | $2,390 | $13,290 |
Source: Public Records
Map
Nearby Homes
Your Personal Tour Guide
Ask me questions while you tour the home.