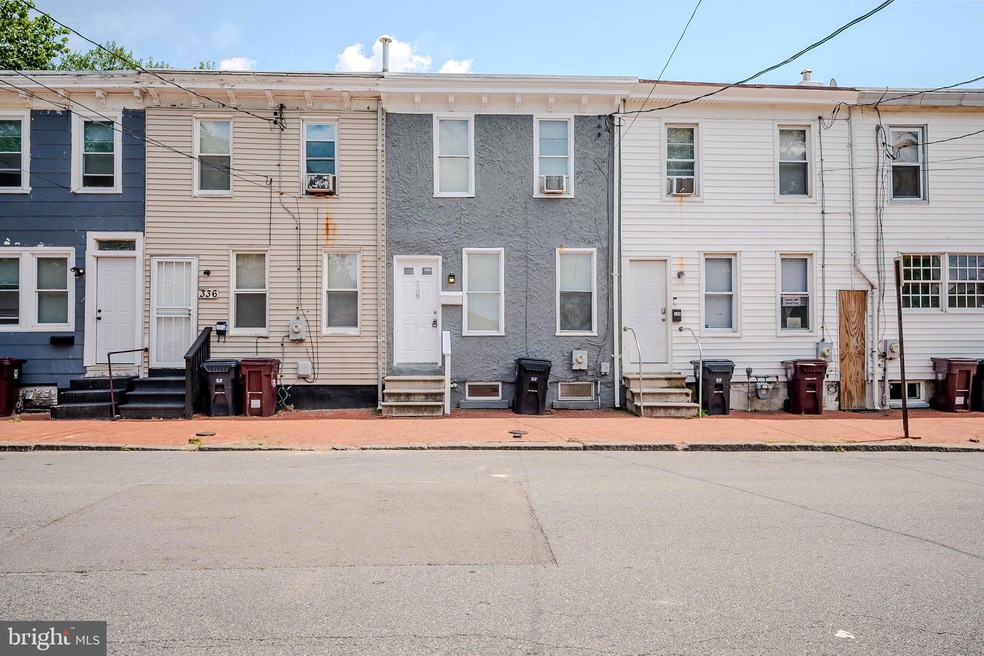
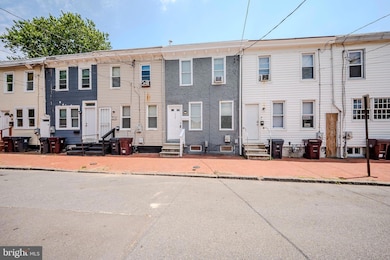
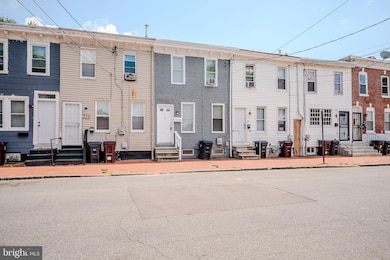
338 S Claymont St Wilmington, DE 19801
South Wilmington NeighborhoodEstimated payment $805/month
Highlights
- Colonial Architecture
- Living Room
- Forced Air Heating System
- No HOA
- Luxury Vinyl Plank Tile Flooring
- 1-minute walk to Barbara Hicks Park
About This Home
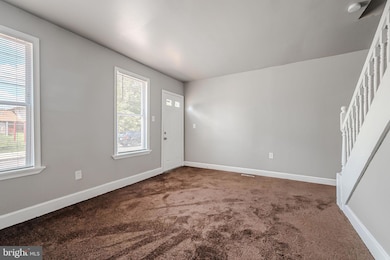
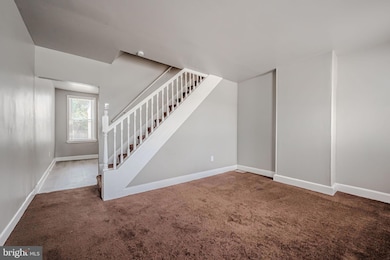
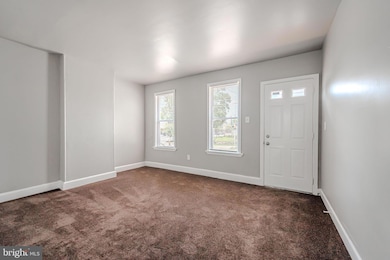
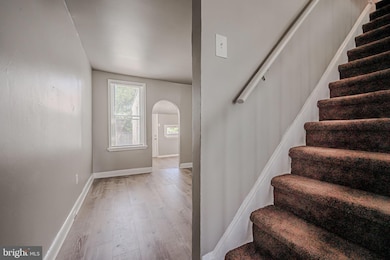
Welcome to 338 S Claymont St! This is a truly affordable housing option for someone who wants to own their own home instead of renting or an investor looking to add a move in ready home to their portfolio! This home which may qualify for financial assistance helping you buy for little to no money out of pocket is conveniently located in the South Bridge area of the City of Wilmington which is a short drive to I-95 for commuting with easy access to Downtown Wilmington and only minutes from the Chase Field Center. Pulling up to this home you’ll notice the ample parking, wide sidewalks, and the grey exterior that stands out on the street. This home features new luxury vinyl plank flooring in the kitchen and dining room (2025), new carpet throughout (2025), and fresh neutral grey paint throughout (2025). The large living and dining rooms provide space for everyday life. The kitchen has been remolded in 2025 to include white cabinets, granite countertops, a new fridge, luxury vinyl plank flooring, and updated fixtures. The private feeling backyard offers useful outdoor space and a fence. Upstairs, you will find two large bedrooms both featuring new carpet and a full bath with a tub/shower combo, luxury vinyl plank flooring, and new fixtures. The basement has been cleaned and painted offering storage room and the laundry hookups. This property is located in a geographical area that may qualify you for financial assistance up to $15,000. There are also more programs available to help buyers purchase a home with little to no money out of pocket through the DSHA (restrictions apply). Contact us to learn more or to schedule your appointment today!
Listing Agent
(302) 893-7438 jake@jsrhomegroup.com RE/MAX Point Realty Listed on: 08/04/2025
Townhouse Details
Home Type
- Townhome
Est. Annual Taxes
- $978
Year Built
- Built in 1900 | Remodeled in 2025
Lot Details
- 1,307 Sq Ft Lot
- Lot Dimensions are 15.00 x 75.00
- Property is in excellent condition
Parking
- On-Street Parking
Home Design
- Colonial Architecture
- Flat Roof Shape
- Brick Exterior Construction
- Brick Foundation
- Stone Foundation
- Stucco
Interior Spaces
- 950 Sq Ft Home
- Property has 2 Levels
- Living Room
- Dining Room
- Basement Fills Entire Space Under The House
- Washer and Dryer Hookup
Flooring
- Carpet
- Luxury Vinyl Plank Tile
Bedrooms and Bathrooms
- 2 Bedrooms
- 1 Full Bathroom
Location
- Flood Risk
Schools
- Elbert-Palmer Elementary School
- Bayard Middle School
- Newark High School
Utilities
- Window Unit Cooling System
- Forced Air Heating System
- Electric Water Heater
- Municipal Trash
Community Details
- No Home Owners Association
- Wilmington Subdivision
Listing and Financial Details
- Tax Lot 152
- Assessor Parcel Number 26-058.10-152
Map
Home Values in the Area
Average Home Value in this Area
Tax History
| Year | Tax Paid | Tax Assessment Tax Assessment Total Assessment is a certain percentage of the fair market value that is determined by local assessors to be the total taxable value of land and additions on the property. | Land | Improvement |
|---|---|---|---|---|
| 2024 | $431 | $11,700 | $1,500 | $10,200 |
| 2023 | $420 | $11,700 | $1,500 | $10,200 |
| 2022 | $416 | $11,700 | $1,500 | $10,200 |
| 2021 | $406 | $11,700 | $1,500 | $10,200 |
| 2020 | $394 | $11,700 | $1,500 | $10,200 |
| 2019 | $576 | $11,700 | $1,500 | $10,200 |
| 2018 | $336 | $11,700 | $1,500 | $10,200 |
| 2017 | $326 | $11,700 | $1,500 | $10,200 |
| 2016 | $325 | $11,700 | $1,500 | $10,200 |
| 2015 | $508 | $11,700 | $1,500 | $10,200 |
| 2014 | $508 | $11,700 | $1,500 | $10,200 |
Property History
| Date | Event | Price | List to Sale | Price per Sq Ft |
|---|---|---|---|---|
| 12/03/2025 12/03/25 | Price Changed | $137,900 | -0.7% | $145 / Sq Ft |
| 11/19/2025 11/19/25 | Price Changed | $138,900 | -0.7% | $146 / Sq Ft |
| 10/09/2025 10/09/25 | Price Changed | $139,900 | -1.4% | $147 / Sq Ft |
| 10/03/2025 10/03/25 | Price Changed | $141,900 | -0.7% | $149 / Sq Ft |
| 09/25/2025 09/25/25 | Price Changed | $142,900 | -0.7% | $150 / Sq Ft |
| 09/18/2025 09/18/25 | Price Changed | $143,900 | -0.7% | $151 / Sq Ft |
| 08/28/2025 08/28/25 | Price Changed | $144,900 | -3.3% | $153 / Sq Ft |
| 08/04/2025 08/04/25 | For Sale | $149,900 | -- | $158 / Sq Ft |
Purchase History
| Date | Type | Sale Price | Title Company |
|---|---|---|---|
| Deed | -- | None Listed On Document | |
| Deed | $10,000 | None Available | |
| Sheriffs Deed | $77,895 | None Available | |
| Deed | $79,900 | None Available | |
| Deed | $28,000 | -- | |
| Deed | -- | -- |
Mortgage History
| Date | Status | Loan Amount | Loan Type |
|---|---|---|---|
| Previous Owner | $79,900 | New Conventional |
Source: Bright MLS
MLS Number: DENC2087044
APN: 26-058.10-152
Disclaimer: Certain information contained herein is derived from information provided by parties other than Homes.com. All information provided is deemed reliable, but is not guaranteed to be accurate and should be independently verified.
![]() The data relating to real estate for sale on this website appears in part through the BRIGHT Internet Data Exchange program, a voluntary cooperative exchange of property listing data between licensed real estate brokerage firms, and is provided by BRIGHT through a licensing agreement.
The data relating to real estate for sale on this website appears in part through the BRIGHT Internet Data Exchange program, a voluntary cooperative exchange of property listing data between licensed real estate brokerage firms, and is provided by BRIGHT through a licensing agreement.
Listing information is from various brokers who participate in the Bright MLS IDX program and not all listings may be visible on the site.
The property information being provided on or through the website is for the personal, non-commercial use of consumers and such information may not be used for any purpose other than to identify prospective properties consumers may be interested in purchasing.
Some properties which appear for sale on the website may no longer be available because they are for instance, under contract, sold or are no longer being offered for sale.
Property information displayed is deemed reliable but is not guaranteed.
Copyright 2025 Bright MLS, Inc.
- 310 S Claymont St
- 304 S Claymont St
- 318 S Claymont St
- 326 New Castle Ave
- 1205 Lobdell St
- 428 S Claymont St
- 434 Queen St
- 308 Townsend St
- 306 Townsend St
- 304 Townsend St
- 434 S Heald St
- 1117 B St
- 609 S Heald St
- 513 S Buttonwood St
- 731 A St
- 511 E 3rd St
- 240 N Lombard St
- 820 N Church St
- 156 Christina Landing Dr
- 836 Bennett St
- 407 S Claymont St
- 1223 Lobdell St
- 425 S Heald St
- 401 A St
- 115 Christina Landing Dr
- 340 S Market St
- 105 Christina Landing Dr Unit 1108
- 903 Kirkwood St
- 210 N Market St
- 308 N Market St
- 211 N Market St
- 2 W 4th St
- 521 N King St
- 101 Ave of the Arts
- 603 N Market St Unit 302
- 627 N Market St
- 517 N Shipley St
- 225 W 4th St Unit 1
- 225 W 4th St Unit 2
- 225 W 4th St
