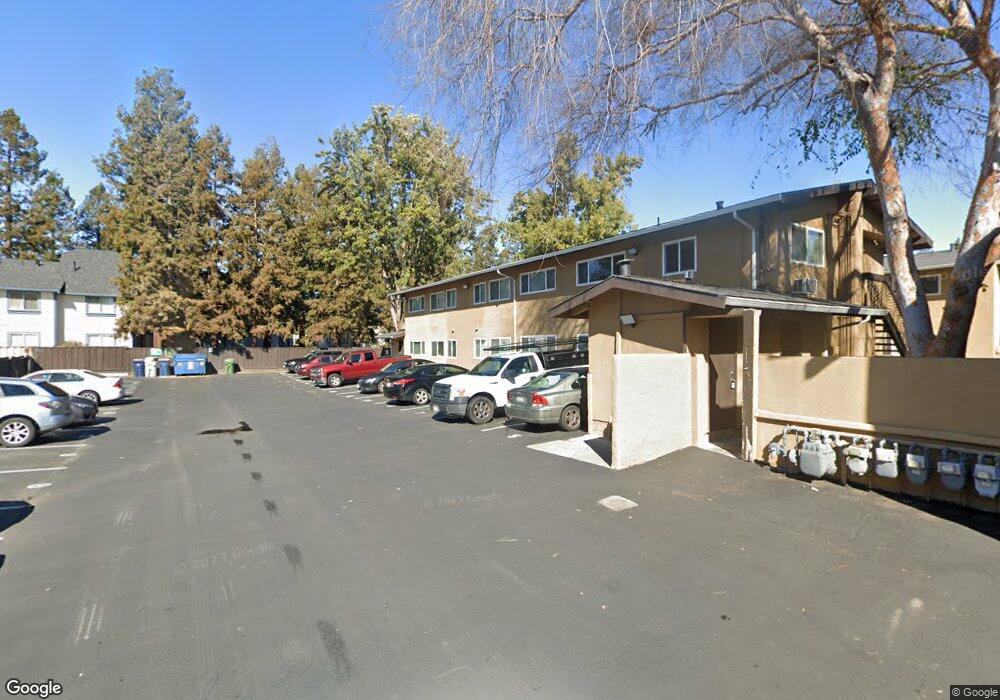
338 Sequim Common Unit 66 Fremont, CA 94539
Warm Springs NeighborhoodEstimated Value: $586,982 - $784,000
2
Beds
2
Baths
897
Sq Ft
$754/Sq Ft
Est. Value
About This Home
This home is located at 338 Sequim Common Unit 66, Fremont, CA 94539 and is currently estimated at $676,496, approximately $754 per square foot. 338 Sequim Common Unit 66 is a home located in Alameda County with nearby schools including James Leitch Elementary School, Warm Springs Elementary School, and John M. Horner Junior High School.
Ownership History
Date
Name
Owned For
Owner Type
Purchase Details
Closed on
Apr 19, 2002
Sold by
Lee Paul C and Lee Nicole H
Bought by
Hung Chiu Yueh
Current Estimated Value
Home Financials for this Owner
Home Financials are based on the most recent Mortgage that was taken out on this home.
Original Mortgage
$165,500
Outstanding Balance
$69,928
Interest Rate
7.08%
Mortgage Type
Purchase Money Mortgage
Estimated Equity
$606,568
Purchase Details
Closed on
Apr 12, 2001
Sold by
Lee Paul C
Bought by
Lee Paul C and Lee Nicole H
Home Financials for this Owner
Home Financials are based on the most recent Mortgage that was taken out on this home.
Original Mortgage
$160,000
Interest Rate
6.98%
Mortgage Type
Purchase Money Mortgage
Purchase Details
Closed on
Aug 30, 1999
Sold by
Cho and Nancy
Bought by
Lee Paul C
Home Financials for this Owner
Home Financials are based on the most recent Mortgage that was taken out on this home.
Original Mortgage
$127,500
Interest Rate
7.75%
Mortgage Type
Purchase Money Mortgage
Purchase Details
Closed on
Jun 1, 1995
Sold by
Cho John and Yu Nancy
Bought by
Cho John and Cho Nancy
Create a Home Valuation Report for This Property
The Home Valuation Report is an in-depth analysis detailing your home's value as well as a comparison with similar homes in the area
Home Values in the Area
Average Home Value in this Area
Purchase History
| Date | Buyer | Sale Price | Title Company |
|---|---|---|---|
| Hung Chiu Yueh | $285,500 | North American Title Co | |
| Lee Paul C | -- | Chicago Title Co | |
| Lee Paul C | $170,000 | Chicago Title Co | |
| Cho John | -- | -- |
Source: Public Records
Mortgage History
| Date | Status | Borrower | Loan Amount |
|---|---|---|---|
| Open | Hung Chiu Yueh | $165,500 | |
| Previous Owner | Lee Paul C | $160,000 | |
| Previous Owner | Lee Paul C | $127,500 | |
| Closed | Lee Paul C | $34,000 |
Source: Public Records
Tax History
| Year | Tax Paid | Tax Assessment Tax Assessment Total Assessment is a certain percentage of the fair market value that is determined by local assessors to be the total taxable value of land and additions on the property. | Land | Improvement |
|---|---|---|---|---|
| 2025 | $5,402 | $421,740 | $126,596 | $295,144 |
| 2024 | $5,402 | $413,472 | $124,114 | $289,358 |
| 2023 | $5,249 | $405,367 | $121,681 | $283,686 |
| 2022 | $5,169 | $397,418 | $119,295 | $278,123 |
| 2021 | $5,052 | $389,627 | $116,956 | $272,671 |
| 2020 | $5,015 | $385,632 | $115,757 | $269,875 |
| 2019 | $4,960 | $378,073 | $113,488 | $264,585 |
| 2018 | $4,862 | $370,661 | $111,263 | $259,398 |
| 2017 | $4,742 | $363,395 | $109,082 | $254,313 |
| 2016 | $4,654 | $356,272 | $106,944 | $249,328 |
| 2015 | $4,583 | $350,922 | $105,338 | $245,584 |
| 2014 | $4,507 | $344,049 | $103,275 | $240,774 |
Source: Public Records
Map
Nearby Homes
- 46636 Winema Common
- 46902 Fernald Common
- 162 Shaniko Common Unit 66
- 93 Shaniko Common Unit 24
- 47101 Benns Terrace
- 277 Hackamore Common
- 304 Hackamore Ln Unit 124
- 152 Hackamore Ln Unit 8
- 134 Hackamore Ln
- 161 Hackamore Ln
- 195 Carson Falls Common
- 769 Covina Way
- 466 Crystalline Dr
- 437 Hollow Falls Common
- 47507 Fortner St
- 46811 Agave Ct
- 0 Tumbleweed Ct
- 45346 Lumen Terrace Unit 302
- 45349 Tom Blalock St Unit 102
- 45378 Tom Blalock St Unit 403
- 354 Sequim Common Unit 70
- 350 Sequim Common
- 342 Sequim Common Unit 67
- 334 Sequim Common Unit 65
- 326 Sequim Common
- 322 Sequim Common
- 366 Sequim Common Unit 73
- 346 Sequim Common
- 330 Sequim Common
- 362 Sequim Common Unit 72
- 318 Sequim Common Unit 61
- 370 Sequim Common
- 358 Sequim Common
- 310 Sequim Common
- 306 Sequim Common
- 302 Sequim Common Unit 57
- 46670 Winema Common
- 268 Sequim Common
- 374 Sequim Common
- 46666 Winema Common Unit N
Your Personal Tour Guide
Ask me questions while you tour the home.