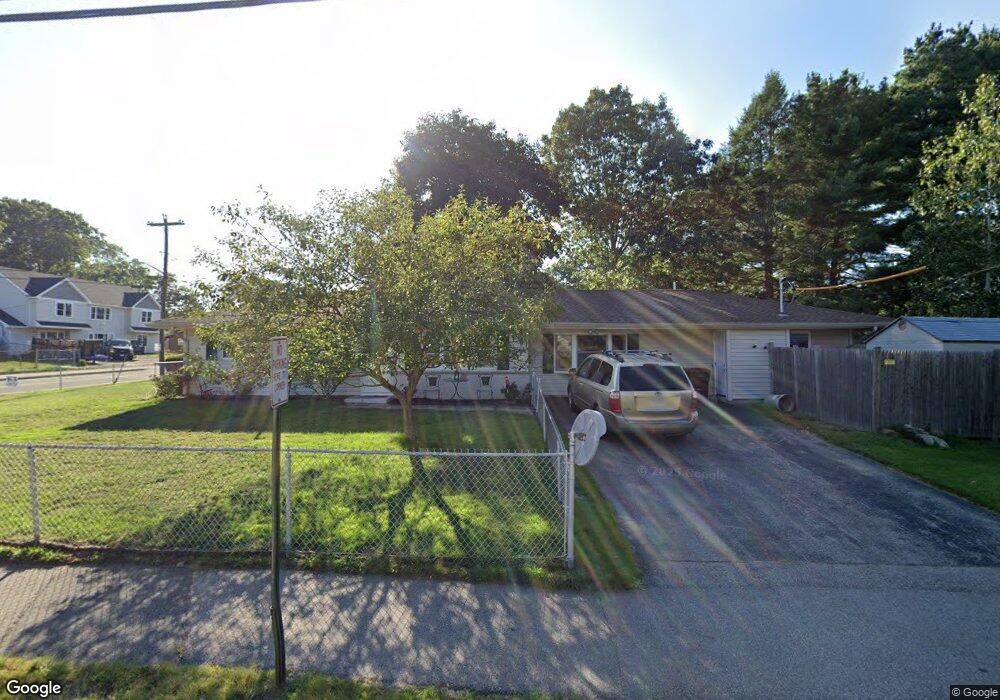
338 Sully Rd Brockton, MA 02302
Montello NeighborhoodEstimated Value: $472,000 - $520,000
3
Beds
1
Bath
1,612
Sq Ft
$307/Sq Ft
Est. Value
About This Home
This home is located at 338 Sully Rd, Brockton, MA 02302 and is currently estimated at $494,177, approximately $306 per square foot. 338 Sully Rd is a home located in Plymouth County with nearby schools including Brookfield Elementary School, Downey Elementary School, and Ashfield Middle School.
Ownership History
Date
Name
Owned For
Owner Type
Purchase Details
Closed on
Jan 23, 1998
Sold by
Santiano Ruth E
Bought by
Lapointe Scott H and Lapointe Jennifer L
Current Estimated Value
Home Financials for this Owner
Home Financials are based on the most recent Mortgage that was taken out on this home.
Original Mortgage
$91,698
Interest Rate
7.11%
Mortgage Type
Purchase Money Mortgage
Create a Home Valuation Report for This Property
The Home Valuation Report is an in-depth analysis detailing your home's value as well as a comparison with similar homes in the area
Home Values in the Area
Average Home Value in this Area
Purchase History
| Date | Buyer | Sale Price | Title Company |
|---|---|---|---|
| Lapointe Scott H | $89,900 | -- |
Source: Public Records
Mortgage History
| Date | Status | Borrower | Loan Amount |
|---|---|---|---|
| Open | Lapointe Scott H | $116,450 | |
| Closed | Lapointe Scott H | $91,698 |
Source: Public Records
Tax History Compared to Growth
Tax History
| Year | Tax Paid | Tax Assessment Tax Assessment Total Assessment is a certain percentage of the fair market value that is determined by local assessors to be the total taxable value of land and additions on the property. | Land | Improvement |
|---|---|---|---|---|
| 2025 | $4,953 | $409,000 | $165,400 | $243,600 |
| 2024 | $4,856 | $404,000 | $165,400 | $238,600 |
| 2023 | $4,631 | $356,800 | $116,000 | $240,800 |
| 2022 | $4,373 | $313,000 | $105,500 | $207,500 |
| 2021 | $4,056 | $279,700 | $99,200 | $180,500 |
| 2020 | $3,854 | $254,400 | $86,400 | $168,000 |
| 2019 | $3,608 | $232,200 | $83,100 | $149,100 |
| 2018 | $3,456 | $215,200 | $83,100 | $132,100 |
| 2017 | $3,020 | $187,600 | $83,100 | $104,500 |
| 2016 | $3,142 | $181,000 | $79,200 | $101,800 |
| 2015 | $2,833 | $156,100 | $79,200 | $76,900 |
| 2014 | $2,712 | $149,600 | $79,200 | $70,400 |
Source: Public Records
Map
Nearby Homes
- 38 Stephen Dr
- 261 Jon Dr
- 18 Brookfield Dr
- 285 Hovendon Ave
- 170 Elsie Rd
- 5 Brookville Ave
- 690 N Quincy St
- 12 Hamilton Way
- 61 Kent St
- 40 Christopher Rd
- 60 Bonney St
- 105 Oscar Ave
- 505 Hampton Way Unit 505
- 279 Howard St
- 200 Sawtell Ave
- 421 Winter St
- 25 Merritt Ave
- 719 S Franklin St Unit L Block 1
- 719 S Franklin St Unit D Block 1
- 719 S Franklin St Unit C Block 1